File:Isentropic analysis 2D.gif
Jump to navigation
Jump to search
No higher resolution available.
Isentropic_analysis_2D.gif (275 × 212 pixels, file size: 9 KB, MIME type: image/gif)
Captions
Captions
Add a one-line explanation of what this file represents
Summary
[edit]
| Description |
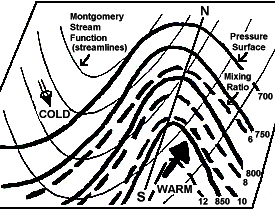
English: Example of an isentropic surface in 2-dimensions. Bold solid (dashed) lines are lines of constant pressure/isobars (mixing ratio/isohumes) while the bold arrow is wind direction on the surface. Flow is from higher-to-lower values of pressure and moisture. Thus, ascent/upward moisture transport is occurring. |
| Date | |
| Source | http://www.crh.noaa.gov/lmk/?n=winterpt1 |
| Author | US National Weather Service office in Louisville, KY |
Licensing
[edit]
This image is in the public domain because it contains materials that originally came from the U.S. National Oceanic and Atmospheric Administration, taken or made as part of an employee's official duties.
|
File history
Click on a date/time to view the file as it appeared at that time.
| Date/Time | Thumbnail | Dimensions | User | Comment | |
|---|---|---|---|---|---|
| current | 17:00, 12 June 2014 | | 275 × 212 (9 KB) | Pierre cb (talk | contribs) | {{Information |Description ={{en|1=Example of an isentropic surface in 2-dimensions. Bold solid (dashed) lines are lines of constant pressure/isobars (mixing ratio/isohumes) while the bold arrow is wind direction on the surface. Flow is from higher-... |
You cannot overwrite this file.
File usage on Commons
The following page uses this file: