File:Lightening1.png
Jump to navigation
Jump to search
Size of this preview: 322 × 599 pixels. Other resolutions: 129 × 240 pixels | 258 × 480 pixels | 412 × 768 pixels | 1,143 × 2,127 pixels.
Original file (1,143 × 2,127 pixels, file size: 1.46 MB, MIME type: image/png)
Captions
Captions
Add a one-line explanation of what this file represents
Summary[edit]
| Description |
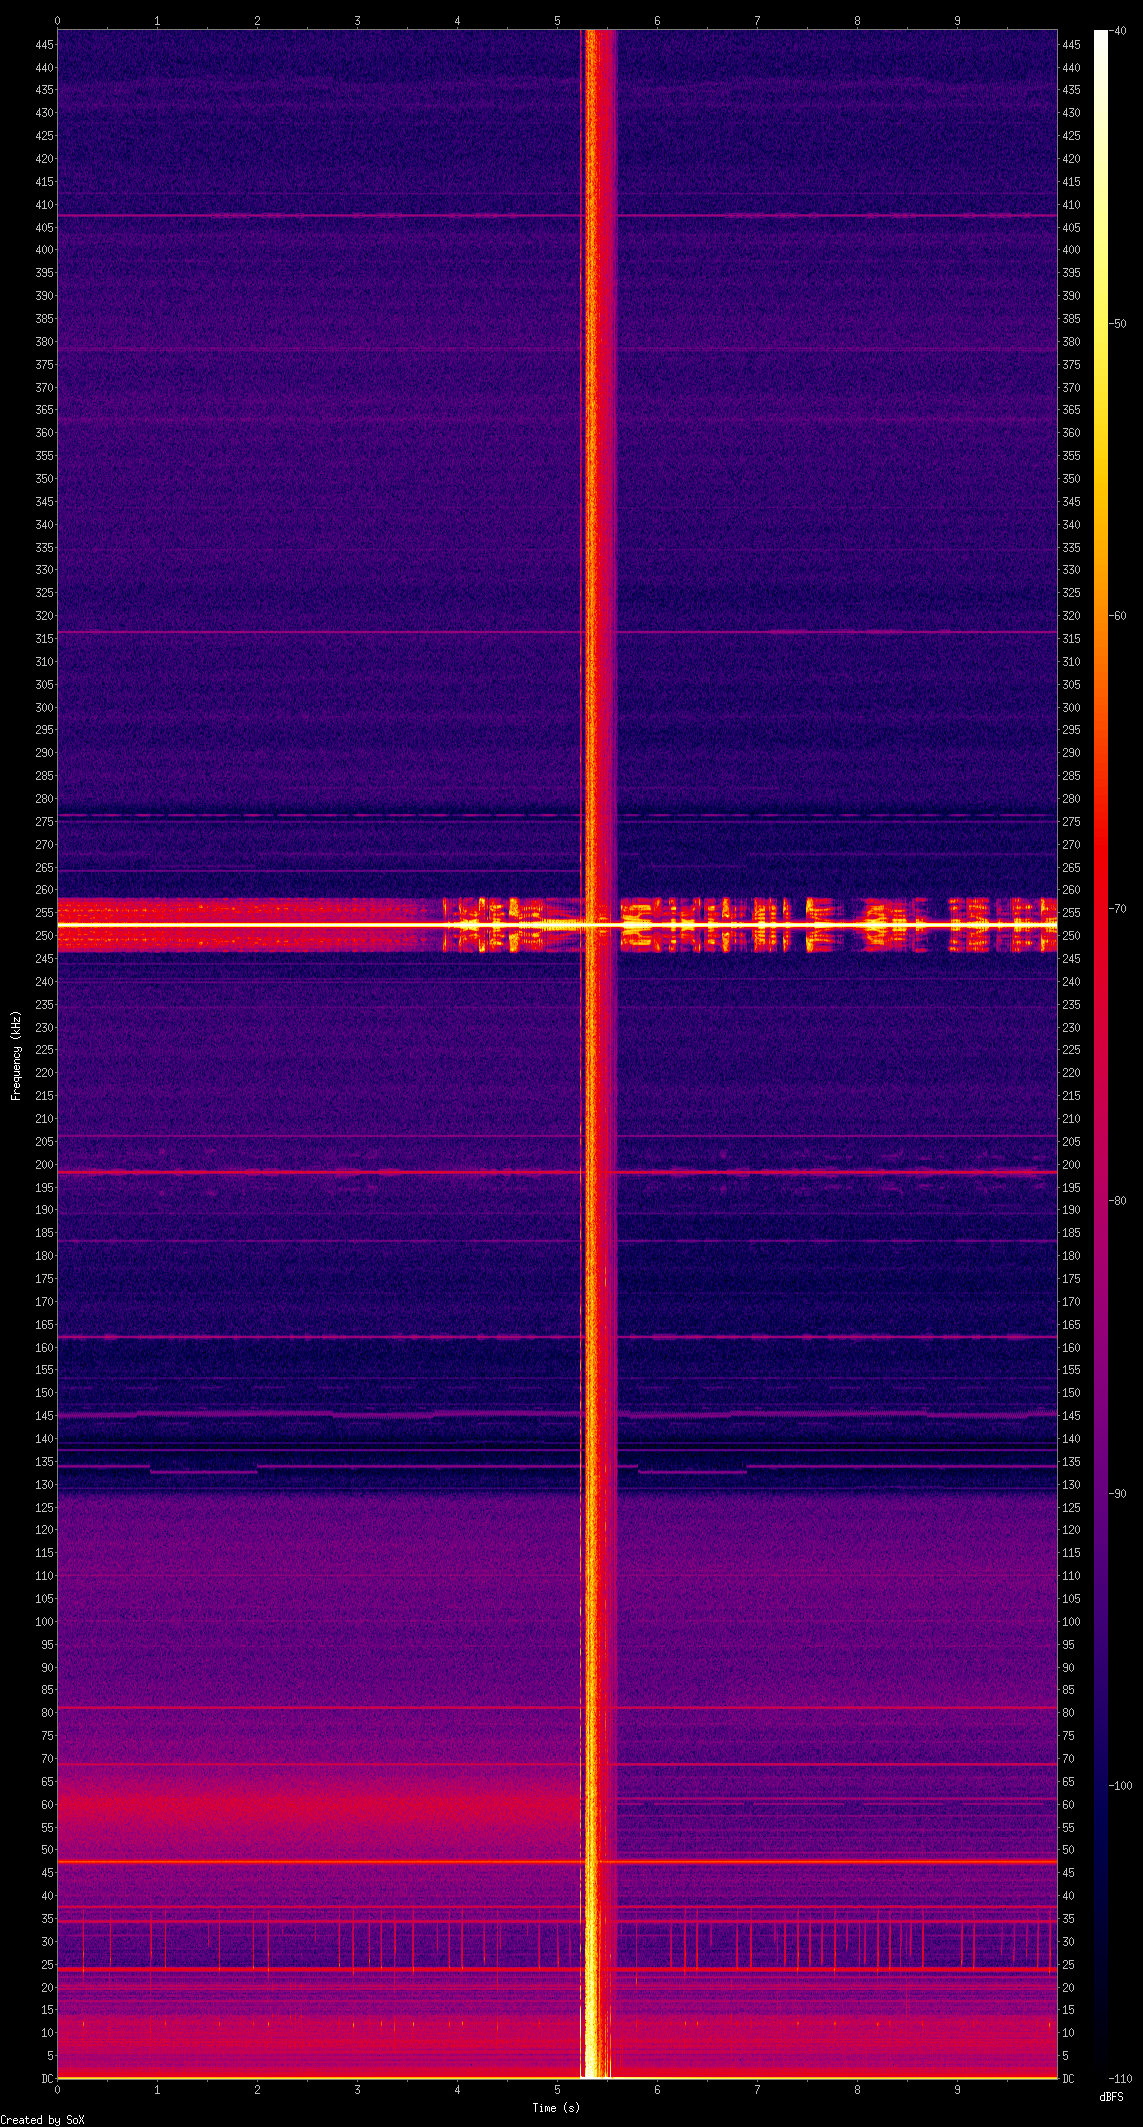
English: This shows ten seconds of long wave radio spectrum as recorded in Dublin, Ireland before, during and after a lightning strike. The 10s of time are shown along the x-axis and the frequency is shown on the y-axis. The amount of power detected at that frequency is shown by the brightness of the colour. For example, the horizontal line at 252kHz shows the RTE Radio 1 transmitter on long wave. The bright vertical line shows the lightning strike itself. By looking before and after the lightning at about 60kHz, we can see the radio transmission conditions have changes, where after the lightning strike a dotted line can be seen, which is the "Rugby" time signal from the UK.
The spectrum was recorded using a software radio built using Juan Domenech Fernandez's modification to a BT878A TV card and a long wire antenna. The samples were processed with the sox command line tool to produce a spectrogram. English: This shows ten seconds of long wave radio spectrum as recorded in Dublin, Ireland before, during and after a lightning strike. The 10s of time are shown along the x-axis and the frequency is shown on the y-axis. The amount of power detected at that frequency is shown by the brightness of the colour. For example, the horizontal line at 252kHz shows the RTE Radio 1 transmitter on long wave. The bright vertical line shows the lightning strike itself. By looking before and after the lightning at about 60kHz, we can see the radio transmission conditions have changes, where after the lightning strike a dotted line can be seen, which is the "Rugby" time signal from the UK. The spectrum was recorded using a software radio built using Juan Domenech Fernandez's modification to a BT878A TV card and a long wire antenna. The samples were processed with the sox command line tool to produce a spectrogram. |
| Date | |
| Source | Own work |
| Author | Dwmalone |
Licensing[edit]
I, the copyright holder of this work, hereby publish it under the following license:
This file is licensed under the Creative Commons Attribution 4.0 International license.
- You are free:
- to share – to copy, distribute and transmit the work
- to remix – to adapt the work
- Under the following conditions:
- attribution – You must give appropriate credit, provide a link to the license, and indicate if changes were made. You may do so in any reasonable manner, but not in any way that suggests the licensor endorses you or your use.
| This image was uploaded as part of Wiki Science Competition 2017. |
File history
Click on a date/time to view the file as it appeared at that time.
| Date/Time | Thumbnail | Dimensions | User | Comment | |
|---|---|---|---|---|---|
| current | 14:27, 30 November 2017 | | 1,143 × 2,127 (1.46 MB) | Dwmalone (talk | contribs) | User created page with UploadWizard |
You cannot overwrite this file.
File usage on Commons
The following 3 pages use this file:
File usage on other wikis
The following other wikis use this file:
- Usage on en.wikipedia.org