File:Mean anomaly diagram.png
Jump to navigation
Jump to search

Size of this preview: 605 × 599 pixels. Other resolutions: 242 × 240 pixels | 485 × 480 pixels | 775 × 768 pixels | 1,034 × 1,024 pixels | 2,128 × 2,108 pixels.
Original file (2,128 × 2,108 pixels, file size: 435 KB, MIME type: image/png)
Captions
Captions
Add a one-line explanation of what this file represents
Summary[edit]
| Description |
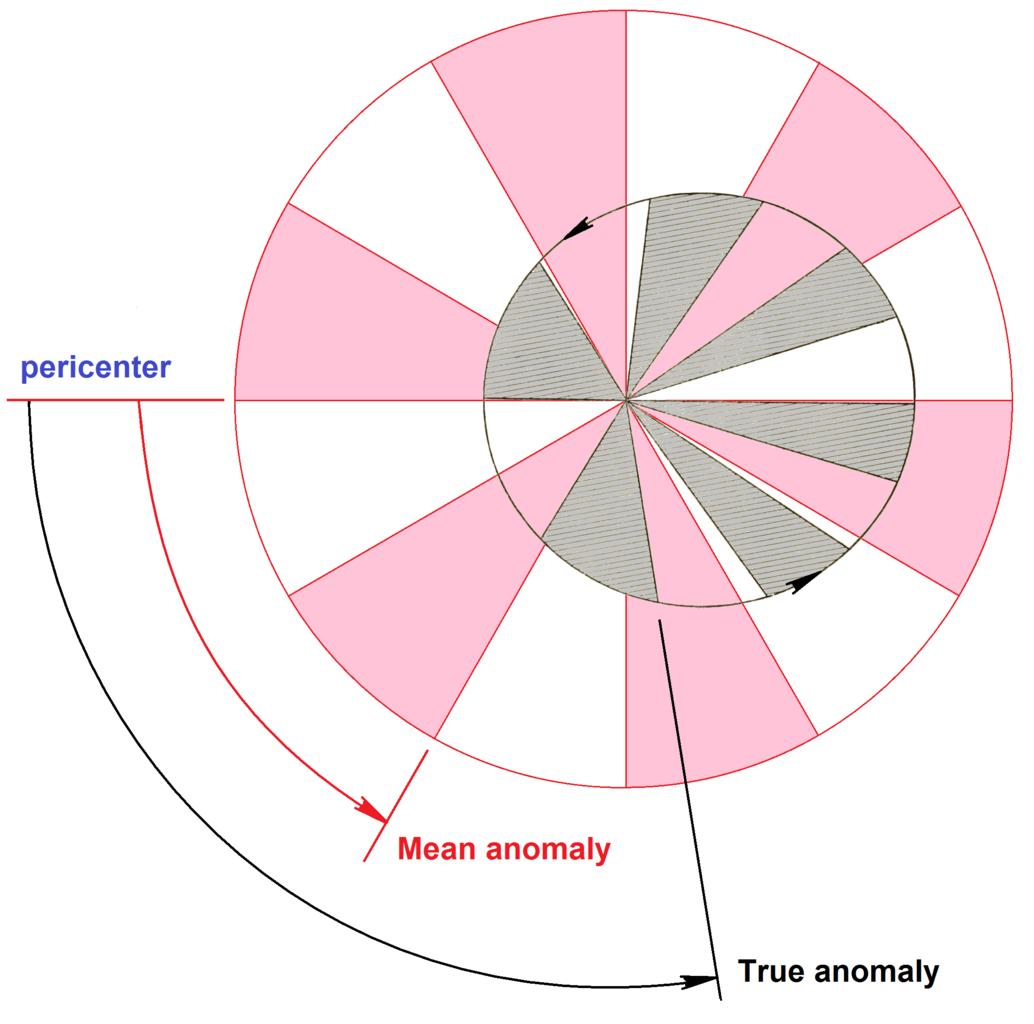
English: Diagram of equal areas swept in equal time, both in a circular orbit and an elliptical orbit. Illustrates the concept of mean anomaly. |
| Date | |
| Source | Own work |
| Author | Tfr000 |
| Other versions |
|

Licensing[edit]
I, the copyright holder of this work, hereby publish it under the following license:
This file is licensed under the Creative Commons Attribution-Share Alike 4.0 International license.
- You are free:
- to share – to copy, distribute and transmit the work
- to remix – to adapt the work
- Under the following conditions:
- attribution – You must give appropriate credit, provide a link to the license, and indicate if changes were made. You may do so in any reasonable manner, but not in any way that suggests the licensor endorses you or your use.
- share alike – If you remix, transform, or build upon the material, you must distribute your contributions under the same or compatible license as the original.
File history
Click on a date/time to view the file as it appeared at that time.
| Date/Time | Thumbnail | Dimensions | User | Comment | |
|---|---|---|---|---|---|
| current | 22:55, 18 November 2015 | | 2,128 × 2,108 (435 KB) | Tfr000 (talk | contribs) | Reverted to version as of 22:49, 18 November 2015 (UTC) this is ridiculous... definitely a bug. One more attempt. |
| 22:52, 18 November 2015 |  | 2,128 × 2,108 (435 KB) | Tfr000 (talk | contribs) | Reverted to version as of 22:49, 18 November 2015 (UTC) one more attempt | |
| 22:52, 18 November 2015 |  | 1,789 × 1,709 (402 KB) | Tfr000 (talk | contribs) | Reverted to version as of 21:28, 17 October 2015 (UTC)did not load correct image | |
| 22:49, 18 November 2015 |  | 2,128 × 2,108 (435 KB) | Tfr000 (talk | contribs) | Added labels for pericenter, mean anomaly, true anomaly and some arrows to show orbit direction. | |
| 22:47, 18 November 2015 |  | 1,789 × 1,709 (402 KB) | Tfr000 (talk | contribs) | Reverted to version as of 21:28, 17 October 2015 (UTC) thumbnail did not load | |
| 10:55, 18 November 2015 |  | 2,128 × 2,108 (437 KB) | Tfr000 (talk | contribs) | added labels for mean anomaly, true anomaly and pericenter | |
| 21:28, 17 October 2015 |  | 1,789 × 1,709 (402 KB) | Tfr000 (talk | contribs) | User created page with UploadWizard |
You cannot overwrite this file.
File usage on Commons
The following 2 pages use this file:
- File:Mean anomaly diagram-ko.png
- File:Mean anomaly diagram 1.png (file redirect)
File usage on other wikis
The following other wikis use this file:
- Usage on ar.wikipedia.org
- Usage on en.wikipedia.org
- Usage on hi.wikipedia.org
- Usage on hr.wikipedia.org
- Usage on mk.wikipedia.org
- Usage on sk.wikipedia.org
- Usage on sr.wikipedia.org
- Usage on tr.wikipedia.org
- Usage on vi.wikipedia.org
- Usage on www.wikidata.org