File:Oil Prices in dollar and euro 1998-2007.gif
Jump to navigation
Jump to search
No higher resolution available.
Oil_Prices_in_dollar_and_euro_1998-2007.gif (748 × 518 pixels, file size: 20 KB, MIME type: image/gif)
Captions
Captions
Add a one-line explanation of what this file represents
| Description |
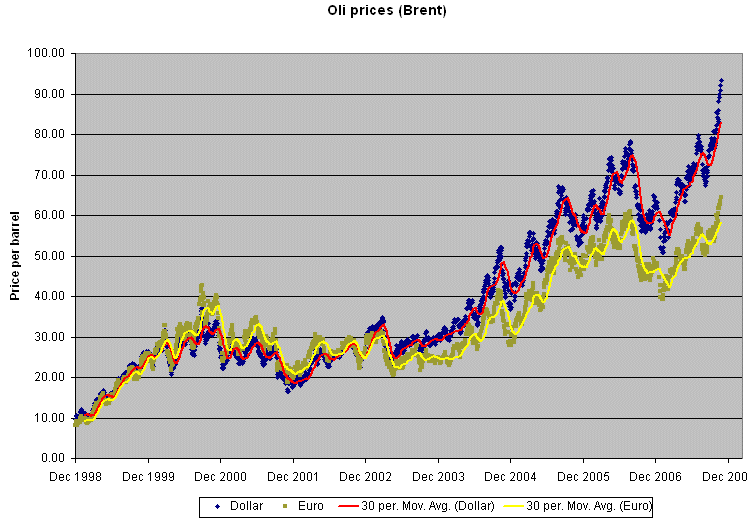
English: This graph shows the development of oil prices (Brent) over the past 10 years in Dollars and in Euros. The difference is caused by the weakening of the dollar relative to the euro. |
| Date | |
| Source | Own work (Original text: self-made) |
| Author | Kim van der Linde |
| Permission (Reusing this file) |
Free for use |
Licensing[edit]
KimvdLinde at English Wikipedia, the copyright holder of this work, hereby publishes it under the following licenses:

|
Permission is granted to copy, distribute and/or modify this document under the terms of the GNU Free Documentation License, Version 1.2 or any later version published by the Free Software Foundation; with no Invariant Sections, no Front-Cover Texts, and no Back-Cover Texts. A copy of the license is included in the section entitled GNU Free Documentation License. |
This file is licensed under the Creative Commons Attribution 3.0 Unported license.
Attribution: KimvdLinde at English Wikipedia
- You are free:
- to share – to copy, distribute and transmit the work
- to remix – to adapt the work
- Under the following conditions:
- attribution – You must give appropriate credit, provide a link to the license, and indicate if changes were made. You may do so in any reasonable manner, but not in any way that suggests the licensor endorses you or your use.
You may select the license of your choice.
Original upload log[edit]
Transferred from en.wikipedia to Commons by Teratornis using CommonsHelper.
The original description page was here. All following user names refer to en.wikipedia.
- 2008-01-02 18:55 KimvdLinde 748×518× (20224 bytes) {{Information |Description=This graph shows the development of oil prices (Brent) over the past 10 years in Dollars and in Euros. The difference is caused by the weakening of he dollar relative to the euro. |Source=self-made |Date=2 January 2008 |Location
File history
Click on a date/time to view the file as it appeared at that time.
| Date/Time | Thumbnail | Dimensions | User | Comment | |
|---|---|---|---|---|---|
| current | 23:45, 8 October 2009 | | 748 × 518 (20 KB) | File Upload Bot (Magnus Manske) (talk | contribs) | {{BotMoveToCommons|en.wikipedia|year={{subst:CURRENTYEAR}}|month={{subst:CURRENTMONTHNAME}}|day={{subst:CURRENTDAY}}}} {{Information |Description={{en|This graph shows the development of oil prices (Brent) over the past 10 years in Dollars and in Euros. |
You cannot overwrite this file.
File usage on Commons
There are no pages that use this file.