File:Optimalalpha.png
Jump to navigation
Jump to search

Size of this preview: 800 × 523 pixels. Other resolutions: 320 × 209 pixels | 640 × 419 pixels | 1,024 × 670 pixels | 1,280 × 837 pixels | 1,686 × 1,103 pixels.
Original file (1,686 × 1,103 pixels, file size: 121 KB, MIME type: image/png)
Captions
Captions
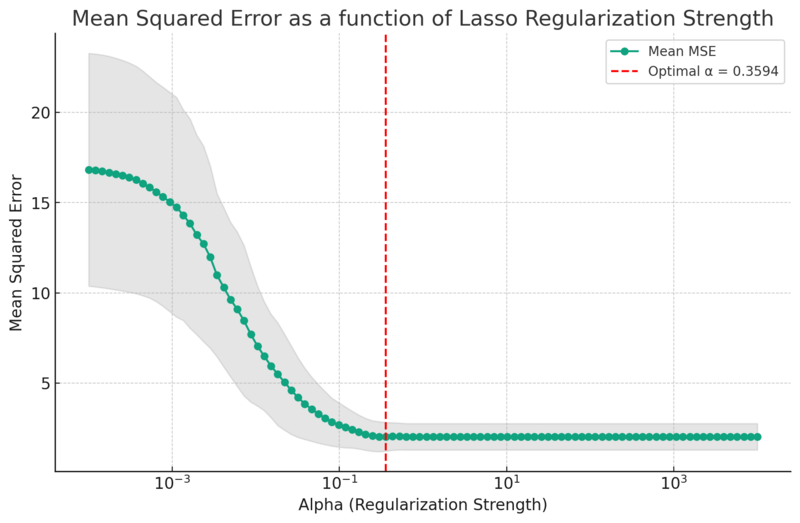
Cross-validated Mean Squared Error (MSE) of Lasso Regression across different regularization strengths (α)
Summary[edit]
| Description |
English: The figure displays the relationship between the regularization strength (α) and the Mean Squared Error (MSE) for a Lasso Regression model using 5-fold cross-validation. The shaded region around the mean MSE curve represents the variability in the MSE across the folds, measured as one standard deviation. As α increases, representing stronger regularization, the model becomes sparser, selecting fewer features. The red dashed line indicates the optimal α value of approximately 0.3594, which minimizes the cross-validated MSE. Balance between fitting the training data and generalizing to new data. |
| Date | |
| Source | Own work |
| Author | Chamaemelum |
Licensing[edit]
I, the copyright holder of this work, hereby publish it under the following license:
This file is licensed under the Creative Commons Attribution 4.0 International license.
- You are free:
- to share – to copy, distribute and transmit the work
- to remix – to adapt the work
- Under the following conditions:
- attribution – You must give appropriate credit, provide a link to the license, and indicate if changes were made. You may do so in any reasonable manner, but not in any way that suggests the licensor endorses you or your use.
File history
Click on a date/time to view the file as it appeared at that time.
| Date/Time | Thumbnail | Dimensions | User | Comment | |
|---|---|---|---|---|---|
| current | 22:45, 25 August 2023 | | 1,686 × 1,103 (121 KB) | Chamaemelum (talk | contribs) | Uploaded own work with UploadWizard |
You cannot overwrite this file.
File usage on Commons
There are no pages that use this file.