File:Perfect competition in the short run.svg
Jump to navigation
Jump to search

Size of this PNG preview of this SVG file: 580 × 400 pixels. Other resolutions: 320 × 221 pixels | 640 × 441 pixels | 1,024 × 706 pixels | 1,280 × 883 pixels | 2,560 × 1,766 pixels.
Original file (SVG file, nominally 580 × 400 pixels, file size: 3 KB)
Captions
Captions
Add a one-line explanation of what this file represents
| Description |
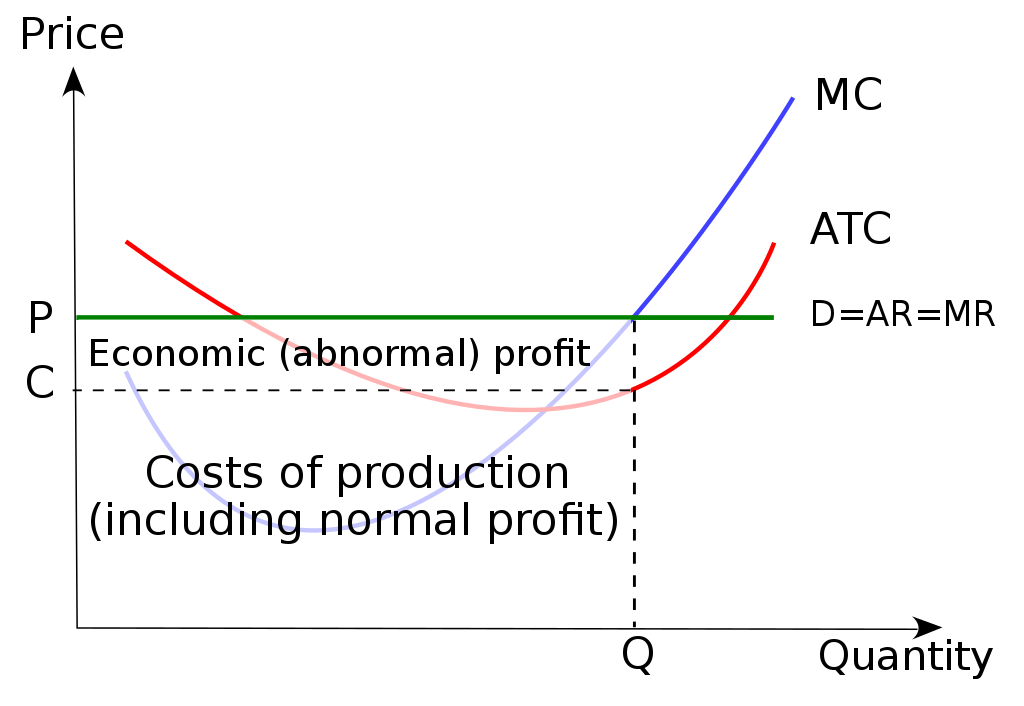
English: Diagram showing that it is possible that a firm in perfect competition makes an abnormal profit, if P > min(ATC). In the long run, however, only normal profits will be made, since P will equal min(ATC) exactly. |
| Date | (UTC) |
| Source | |
| Author |
|
| Other versions |
 .svg) |
This file is licensed under the Creative Commons Attribution-Share Alike 3.0 Unported license.
- You are free:
- to share – to copy, distribute and transmit the work
- to remix – to adapt the work
- Under the following conditions:
- attribution – You must give appropriate credit, provide a link to the license, and indicate if changes were made. You may do so in any reasonable manner, but not in any way that suggests the licensor endorses you or your use.
- share alike – If you remix, transform, or build upon the material, you must distribute your contributions under the same or compatible license as the original.
Original upload log[edit]
This image is a derivative work of the following images:
- File:Perfect_competition_in_the_short_run.png licensed with Cc-by-sa-3.0-migrated-with-disclaimers, GFDL-en, GFDL-user-en-with-disclaimers
- 2008-10-10T11:36:52Z Iroony 653x496 (10875 Bytes) {{Information |Description={{en|Diagram showing that it is possible that a firm in perfect competition makes an abnormal profit. However, the condition for long run AR=MR}} |Source=Transferred from [http://en.wikipedia.org en
- File:Costcurve_-_Combined.svg licensed with Cc-by-3.0
- 2010-09-26T19:21:16Z Jarry1250 560x400 (2867 Bytes) {{Information |Description={{en|Three [[:en:cost curve|cost curves]] (average total cost, marginal cost, and marginal revenue) overlaid.}} |Source=*[[:File:Costcurve_-_Combined.png|]] |Date=2010-09-26 19:20 (UTC) |Author=*[[:
Uploaded with derivativeFX
File history
Click on a date/time to view the file as it appeared at that time.
| Date/Time | Thumbnail | Dimensions | User | Comment | |
|---|---|---|---|---|---|
| current | 16:18, 15 October 2010 | | 580 × 400 (3 KB) | Jarry1250 (talk | contribs) | == int:filedesc == == int:filedesc == Better economics |
| 20:59, 5 October 2010 |  | 560 × 400 (4 KB) | Jarry1250 (talk | contribs) | == Summary == Economics error fixed. | |
| 20:52, 5 October 2010 |  | 560 × 400 (4 KB) | Jarry1250 (talk | contribs) | == Summary == Try to realign again. | |
| 20:51, 5 October 2010 |  | 560 × 400 (4 KB) | Jarry1250 (talk | contribs) | == Summary == == Summary == Minor fixes | |
| 20:45, 5 October 2010 |  | 560 × 400 (4 KB) | Jarry1250 (talk | contribs) | {{Information |Description={{en|Diagram showing that it is possible that a firm in en:perfect competition makes an abnormal profit, if P > min(ATC). In the en:long run, however, only normal profits will be made, since P |
You cannot overwrite this file.
File usage on Commons
The following 2 pages use this file:
File usage on other wikis
The following other wikis use this file:
- Usage on en.wikipedia.org
- Usage on kn.wikipedia.org