File:PlanckDist ny lambda en.png
Jump to navigation
Jump to search
Size of this preview: 800 × 267 pixels. Other resolutions: 320 × 107 pixels | 900 × 300 pixels.
Original file (900 × 300 pixels, file size: 7 KB, MIME type: image/png)
Captions
Captions
Add a one-line explanation of what this file represents
Summary
[edit]
| Description |
Deutsch: Die Punkte in diesem Diagramm folgen einer Planckverteilung (für T: 600 K). Eingezeichnet sind auch Frequenzintervalle konstanter Länge (jeweils 10 THz) und Wellenlängenintervalle konstanter Länge (jeweils 1 µm). Für jedes Intervall ist die Anzahl der darin enthaltenen Punkte angegeben. Wie sofort zu sehen ist, enthält das Frequenzintervall zwischen 30 und 40 Thz mehr Punkte als jedes andere Frequenzintervall (13), während das Wellenlängenintervall zwischen 4 und 5 µm mehr Punkte enthält als jedes andere Wellenlängenintervall (10). Rechnet man jedoch die Frequenz, bei der das Maximum auftritt, in die entsprechende Wellenlänge um, so erhält man nicht jene Wellenlänge, bei welcher das Maximum auftritt, wenn die Wellenlängenintervalle betrachtet werden. Trägt man das Diagramm einmal gegen eine lineare Frequenzachse und einmal gegen eine lineare Wellenlängenachse auf, so ist auch optisch erkennbar, wie sich die Punkte in jeweils unterschiedlichen Bereichen der Achse zusammendrängen. Es gibt kein "objektives" Maximum.
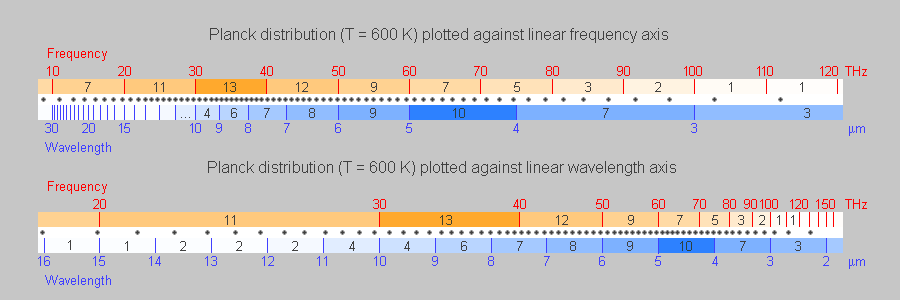
English: The dots in this diagram follow a Planck distribution (for T: 600 K). The diagram also shows frequency intervals of constant length (each 10 THz) and wavelength intervals of constant length (each 1 µm). The number of dots falling in each interval is indicated. As can be seen, the frequency interval between 30 and 40 Thz contains more dots than any other frequency interval (13), and the wavelength interval between 4 and 5 µm contains more dots than any other wavelength interval (10). However, when the frequency at which the maximum occurs is converted into the corresponding wavelength, it does not coincide with the wavelength where the maximum occurs when wavelengths are considered. Plotting the distribution against linear frequency and wavelength axes makes it evident how the dots bunch up in different parts of the axes, depending on whether frequency or wavelength is considered. There is no "objective" maximum.
|
| Date | 9 August 2007 (original upload date) |
| Source | No machine-readable source provided. Own work assumed (based on copyright claims). |
| Author | No machine-readable author provided. Sch assumed (based on copyright claims). |
Licensing
[edit]
I, the copyright holder of this work, hereby publish it under the following licenses:

|
Permission is granted to copy, distribute and/or modify this document under the terms of the GNU Free Documentation License, Version 1.2 or any later version published by the Free Software Foundation; with no Invariant Sections, no Front-Cover Texts, and no Back-Cover Texts. A copy of the license is included in the section entitled GNU Free Documentation License. |
| This file is licensed under the Creative Commons Attribution-Share Alike 3.0 Unported license. | ||
| ||
| This licensing tag was added to this file as part of the GFDL licensing update. |
You may select the license of your choice.
File history
Click on a date/time to view the file as it appeared at that time.
| Date/Time | Thumbnail | Dimensions | User | Comment | |
|---|---|---|---|---|---|
| current | 20:34, 9 August 2007 | 900 × 300 (7 KB) | Sch (talk | contribs) | *Description: {{german}} Die Punkte in diesem Diagramm folgen einer Planckverteilung (für T = 600 K). Eingezeichnet sind auch Frequenzintervalle konstanter Länge (jeweils 10 THz) und Wellenlängenintervalle konstanter Länge (jeweils 1 µm). Für jedes |
You cannot overwrite this file.
File usage on Commons
There are no pages that use this file.
File usage on other wikis
The following other wikis use this file:
- Usage on de.wikipedia.org