File:Puyuk Lake pollen diagram 1.svg

Original file (SVG file, nominally 720 × 900 pixels, file size: 116 KB)
Captions
Captions
Summary[edit]
| Description |
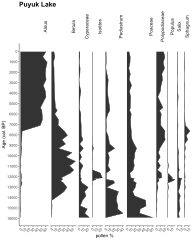
English: Pollen diagram of Puyuk Lake, Alaska, Beringia |
| Date | |
| Source | Own work |
| Author | Merikanto |
This image is based global pollen data from Neotoma.
Puyuk Lake
Site ID	1920
Longitude	-162,2
Latitude	63,5
Description	Maar crater on volcanic island. Physiography: subdued rounded hills and volcanic cones. Surrounding vegetation: mesic low-shrub tundra.
PIs: Ager, Thomas A.
Ager, T.A. 1980. A 16,000 year pollen record from St. Michael Island, Norton Sound, western Alaska. Page 3 in American Quaternary Association, Sixth Biennial Meeting, Abstracts and Program, 18-20 August 1980. Institute for Quaternary Studies, University of Maine, Orono, Maine, USA.
Ager, T.A. 1982. Vegetational history of western Alaska during the WIsconsin glacial interval and the Holocene. Pages 75-93 in D.M. Hopkins, J.V. Matthews, Jr., C.E. Schweger, and S.B. Young, editors. Paleoecology of Beringia. Academic Press, New York, New York, USA.
Ager, T.A., and J.P. Bradbury. 1982. Quaternary history of vegetation and climate of the Yukon Delta-Norton Sound Area. In W.L. Conrad, editor. The United States Geological Survey in Alaska: Accomplishments during 1981. U.S. Geological Survey Circular 868:103-105.
Ager, T.A., and L.B. Brubaker. 1985. Quaternary palynology and vegetational history of Alaska. Pages 353-384 in V.M. Bryant, Jr. and R.G. Holloway, editors. Pollen records of late Quaternary North American sediments. American Association of Stragigraphic Palynologists Foundation, Dallas, Texas, USA.
- Pollen diagram, arranged by pollen %
- "R" script, uses neotoma, ggplot2 ...
- 22.10.2021 0000.0000
- original src
- http://paleoecologie.umontreal.ca/684-2/
library(ggplot2)
library(grid)
library(neotoma)
library(analogue)
library(rioja)
library(ggdendro)
library(gridExtra)
sitename1='Puyuk Lake'
sitename2=paste0(sitename1,'%')
suze <- get_site(sitename = sitename2)
suze_pollen=get_dataset(suze)
suze_data=get_download(suze_pollen)
- head(suze_data1$counts)
core.pct <- data.frame(tran(suze_data1$counts, method = 'percent'))
age <- suze_data1$sample.meta$age
core.pct <- chooseTaxa(core.pct, max.abun = 10)
- Stratiplot(age ~ ., core.pct, sort = 'wa', type = 'poly',
- ylab ='Years Before Present')
df=data.frame(yr=rep(age,ncol(core.pct)),
per=as.vector(as.matrix(core.pct)),
taxa=as.factor(rep(colnames(core.pct),each=nrow(core.pct))))

theme_new <- theme(panel.grid.major = element_blank(), panel.grid.minor = element_blank(), # remove grids
panel.background = element_blank(), axis.line = element_line(colour = "black"),
strip.text.x = element_text(size=14, angle=90, vjust=0), # Taxa names
strip.background = element_blank(),
strip.text.y = element_text(angle = 0),
legend.position="none",panel.border = element_blank(),
axis.text.x=element_text(angle=45,hjust=1)) # Axis tick label angle
diag= ggplot(df)+
theme(text = element_text(size = 14))+
ggtitle(sitename1)+
theme(plot.title = element_text(size = 20, face = "bold" ) ) +
geom_line(aes(yr,per))+
geom_area(aes(yr,per))+
scale_x_reverse(breaks =seq(0,100000,1000))+
scale_y_continuous(breaks =seq(0,100,10))+
xlab("Age (cal. BP)")+ylab("pollen %")+
coord_flip()+
theme_new+
facet_grid(~df$taxa,scales = "free", space = "free")+
svg(filename="./puyuk_lake_pollen_1.svg", width=8, height=10, pointsize=16)


diag
dev.off()
print(".")
Licensing[edit]
- You are free:
- to share – to copy, distribute and transmit the work
- to remix – to adapt the work
- Under the following conditions:
- attribution – You must give appropriate credit, provide a link to the license, and indicate if changes were made. You may do so in any reasonable manner, but not in any way that suggests the licensor endorses you or your use.
- share alike – If you remix, transform, or build upon the material, you must distribute your contributions under the same or compatible license as the original.
File history
Click on a date/time to view the file as it appeared at that time.
| Date/Time | Thumbnail | Dimensions | User | Comment | |
|---|---|---|---|---|---|
| current | 12:57, 22 October 2021 | | 720 × 900 (116 KB) | Merikanto (talk | contribs) | Uploaded own work with UploadWizard |
You cannot overwrite this file.
File usage on Commons
There are no pages that use this file.