File:SC diagramme.svg
Jump to navigation
Jump to search

Size of this PNG preview of this SVG file: 438 × 180 pixels. Other resolutions: 320 × 132 pixels | 640 × 263 pixels | 1,024 × 421 pixels | 1,280 × 526 pixels | 2,560 × 1,052 pixels.
Original file (SVG file, nominally 438 × 180 pixels, file size: 94 KB)
Captions
Captions
Add a one-line explanation of what this file represents
Summary[edit]
| Description |
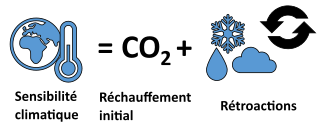
Français : Diagramme des facteurs qui déterminent la sensibilité climatique. Après une augmentation des niveaux de CO2 (ou de tout autre type de forçage), le système climatique commence immédiatement à se réchauffer. Ce réchauffement est amplifié par l'effet net des rétroactions. Les rétroactions qui se renforcent d'elles-mêmes sont la vapeur d'eau, la glace-albédo et les nuages. La rétroaction stabilisatrice du taux de déphasage est plus faible que les rétroactions autorenforçantes. |
| Date | |
| Source | Own work |
| Author |
Fichier original : Femkemilene Traduction : Espandero |
| Other versions |
|
Licensing[edit]
This file is licensed under the Creative Commons Attribution-Share Alike 4.0 International license.
- You are free:
- to share – to copy, distribute and transmit the work
- to remix – to adapt the work
- Under the following conditions:
- attribution – You must give appropriate credit, provide a link to the license, and indicate if changes were made. You may do so in any reasonable manner, but not in any way that suggests the licensor endorses you or your use.
- share alike – If you remix, transform, or build upon the material, you must distribute your contributions under the same or compatible license as the original.
File history
Click on a date/time to view the file as it appeared at that time.
| Date/Time | Thumbnail | Dimensions | User | Comment | |
|---|---|---|---|---|---|
| current | 09:22, 13 June 2023 | 438 × 180 (94 KB) | Espandero (talk | contribs) | Uploaded a work by Fichier original : Femkemilene Traduction : Espandero from File:CS diagram.svg with UploadWizard |
You cannot overwrite this file.
File usage on Commons
The following page uses this file:
File usage on other wikis
The following other wikis use this file:
- Usage on fr.wikipedia.org