File:SolarSystemSizes.PNG

Original file (610 × 610 pixels, file size: 29 KB, MIME type: image/png)
Captions
Captions
Summary[edit]
| DescriptionSolarSystemSizes.PNG |
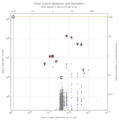
English: Log-log plot (red-dots) of solar-system object diameters versus "distance from the sun". The diameter of natural satellites (moons) associated with these objects are plotted (as blue-triangles) below them. The plot only includes a few comets (magenta diagonals), which often have unknown diameters and orbits that are highly eccentric (and sometimes well out of the ecliptic). The plot uses standard planetary symbols, except that C refers to dwarf-planet Ceres while dwarf-planets Haumea, Makemake, Eris and trans-Neptunian object Sedna (far right) are only shown by red dots. Minor planets including the next smaller asteroids Vesta, Pallas and Hygiea are shown as grey dots instead. |
| Date | |
| Source | Own work |
| Author | P. Fraundorf |
Licensing[edit]
- You are free:
- to share – to copy, distribute and transmit the work
- to remix – to adapt the work
- Under the following conditions:
- attribution – You must give appropriate credit, provide a link to the license, and indicate if changes were made. You may do so in any reasonable manner, but not in any way that suggests the licensor endorses you or your use.
- share alike – If you remix, transform, or build upon the material, you must distribute your contributions under the same or compatible license as the original.
File history
Click on a date/time to view the file as it appeared at that time.
| Date/Time | Thumbnail | Dimensions | User | Comment | |
|---|---|---|---|---|---|
| current | 13:02, 9 March 2016 |  | 610 × 610 (29 KB) | Unitsphere (talk | contribs) | Added eccentricity information for 2012VP113. |
| 17:26, 8 March 2016 |  | 608 × 612 (29 KB) | Unitsphere (talk | contribs) | Add horizontal lines to show perihelion and aphelion radii, and also correct labels for Neptune and Uranus. | |
| 16:37, 3 March 2016 |  | 503 × 513 (17 KB) | Unitsphere (talk | contribs) | Add a couple of trans-Neptunian objects as well. | |
| 15:26, 3 March 2016 |  | 510 × 516 (18 KB) | Unitsphere (talk | contribs) | Plot now covers almost 10 orders of magnitude in size (from 12 miles across to 668 AU), and includes a few comets. | |
| 15:24, 2 March 2016 |  | 370 × 375 (11 KB) | Unitsphere (talk | contribs) | User created page with UploadWizard |
You cannot overwrite this file.
File usage on Commons
There are no pages that use this file.
Metadata
This file contains additional information such as Exif metadata which may have been added by the digital camera, scanner, or software program used to create or digitize it. If the file has been modified from its original state, some details such as the timestamp may not fully reflect those of the original file. The timestamp is only as accurate as the clock in the camera, and it may be completely wrong.
| Horizontal resolution | 37.79 dpc |
|---|---|
| Vertical resolution | 37.79 dpc |