File:Spectrum test cjt H.svg
Jump to navigation
Jump to search

Size of this PNG preview of this SVG file: 800 × 460 pixels. Other resolutions: 320 × 184 pixels | 640 × 368 pixels | 1,024 × 589 pixels | 1,280 × 736 pixels | 2,560 × 1,472 pixels | 960 × 552 pixels.
Original file (SVG file, nominally 960 × 552 pixels, file size: 6 KB)
Captions
Captions
Add a one-line explanation of what this file represents
Summary[edit]
| Description |
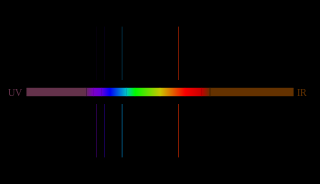
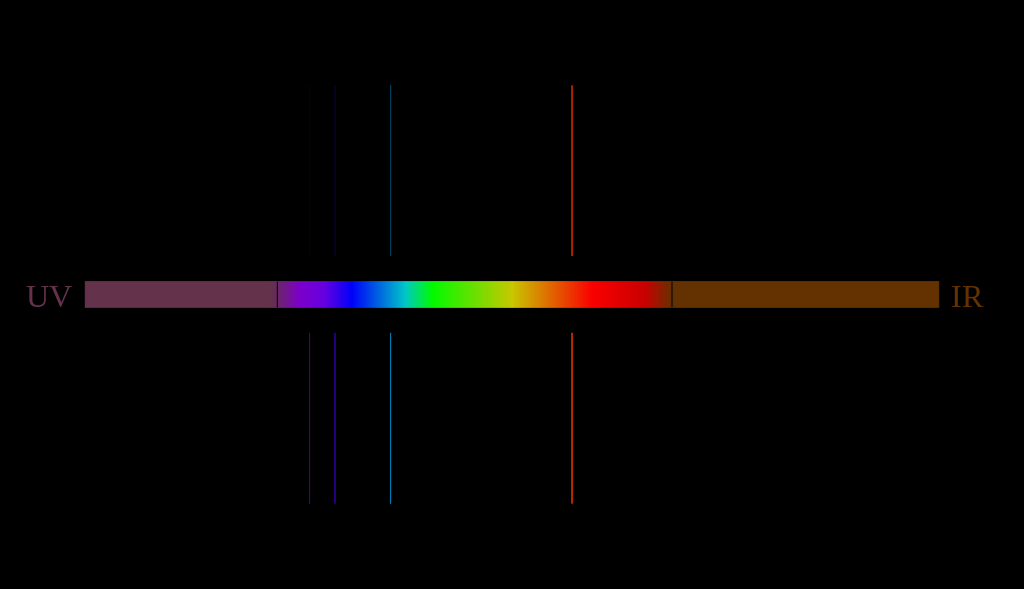
English: This is a diagram of the emission spectrum of hydrogen, over the wavelength range of 200 to 1000 nm (near-ultraviolet through near-infrared). Data source: NIST. The upper plot has linearly scaled intensities, while the lower plot has logarithmically scaled intensities (to show fainter lines).
I, the author of this image, hereby release it for use under the Creative Commons "Share Alike" license. --Christopher Thomas (talk) 06:34, 19 October 2009 (UTC) |
| Date | 19 October 2009 (original upload date) |
| Source | Transferred from en.wikipedia to Commons by IngerAlHaosului using CommonsHelper. |
| Author | The original uploader was Christopher Thomas at English Wikipedia. |
| Permission (Reusing this file) |
CC-SA. |
Licensing[edit]
This file is licensed under Creative Commons ShareAlike 1.0 License.
Creative Commons has retired this legal tool and does not recommend that it be applied to works.
|
Original upload log[edit]
The original description page was here. All following user names refer to en.wikipedia.
- 2009-10-19 06:34 Christopher Thomas 960×552× (5687 bytes) ==Summary== This is a diagram of the [[emission spectrum]] of [[hydrogen]], over the wavelength range of 200 to 1000 [[nanometre|nm]] (near-[[ultraviolet]] through near-[[infrared]]). Data source: [[NIST]]. The upper plot has linearly scaled intensities,
File history
Click on a date/time to view the file as it appeared at that time.
| Date/Time | Thumbnail | Dimensions | User | Comment | |
|---|---|---|---|---|---|
| current | 12:09, 18 January 2010 | | 960 × 552 (6 KB) | File Upload Bot (Magnus Manske) (talk | contribs) | {{BotMoveToCommons|en.wikipedia|year={{subst:CURRENTYEAR}}|month={{subst:CURRENTMONTHNAME}}|day={{subst:CURRENTDAY}}}} {{Information |Description={{en|This is a diagram of the en:emission spectrum of en:hydrogen, over the wavelength range of |
You cannot overwrite this file.
File usage on Commons
There are no pages that use this file.
File usage on other wikis
The following other wikis use this file:
- Usage on en.wikipedia.org
- Usage on tr.wikipedia.org