File:Tokamak fusion-triple-product-diagram Smith.jpg
Jump to navigation
Jump to search

Size of this preview: 486 × 600 pixels. Other resolutions: 194 × 240 pixels | 389 × 480 pixels | 622 × 768 pixels | 1,037 × 1,280 pixels.
Original file (1,037 × 1,280 pixels, file size: 107 KB, MIME type: image/jpeg)
Captions
Captions
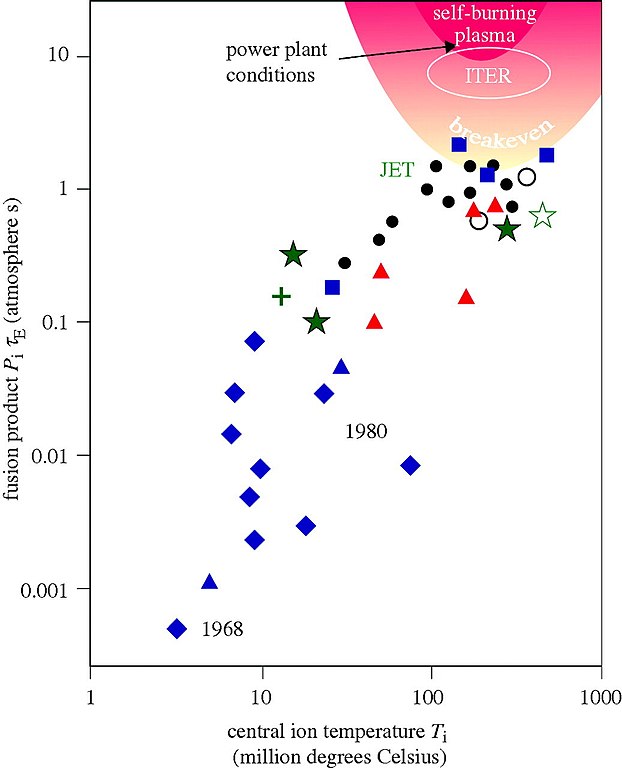
Tokamak temperature and fusion triple product diagram
Summary[edit]
| Description |
English: Selected results from different tokamaks demonstrate substantial progress over recent decades from the low temperature, low energy gain points at the bottom left. Temperatures above 100 M°C are now routinely achieved and an energy gain of around one has been reached. A power plant needs an energy gain (Q) above 10, and this should be achieved in ITER. |
| Date | |
| Source | Smith Chris Llewellyn and Cowley Steve, 2010 The path to fusion power, Phil. Trans. R. Soc. A.3681091–1108 Figure 3 |
| Author | Smith Chris Llewellyn and Cowley Steve |
Licensing[edit]
This file is licensed under the Creative Commons Attribution 3.0 Unported license.
- You are free:
- to share – to copy, distribute and transmit the work
- to remix – to adapt the work
- Under the following conditions:
- attribution – You must give appropriate credit, provide a link to the license, and indicate if changes were made. You may do so in any reasonable manner, but not in any way that suggests the licensor endorses you or your use.
File history
Click on a date/time to view the file as it appeared at that time.
| Date/Time | Thumbnail | Dimensions | User | Comment | |
|---|---|---|---|---|---|
| current | 21:18, 29 March 2021 | | 1,037 × 1,280 (107 KB) | Geek3 (talk | contribs) | Uploaded a work by Smith Chris Llewellyn and Cowley Steve from [http://doi.org/10.1098/rsta.2009.0216 Smith Chris Llewellyn and Cowley Steve, 2010 The path to fusion power, Phil. Trans. R. Soc. A.3681091–1108 Figure 3] with UploadWizard |
You cannot overwrite this file.
File usage on Commons
The following page uses this file: