File:Transportation pollution.svg
Jump to navigation
Jump to search

Size of this PNG preview of this SVG file: 744 × 524 pixels. Other resolutions: 320 × 225 pixels | 640 × 451 pixels | 1,024 × 721 pixels | 1,280 × 902 pixels | 2,560 × 1,803 pixels.
Original file (SVG file, nominally 744 × 524 pixels, file size: 18 KB)
Captions
Captions
Add a one-line explanation of what this file represents
Summary
[edit]
| Description |
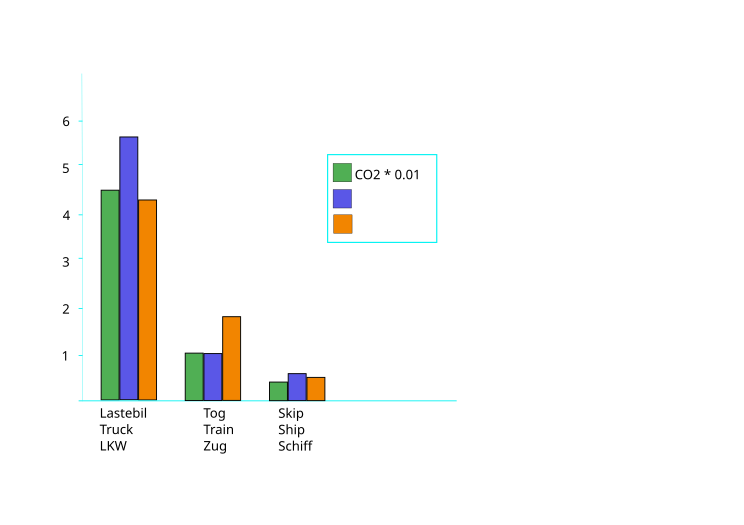
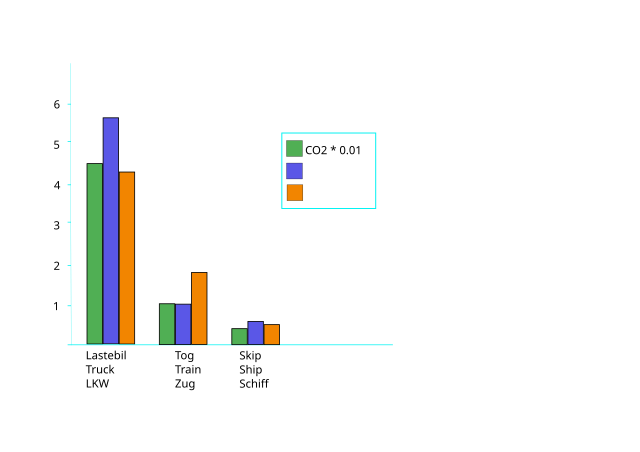
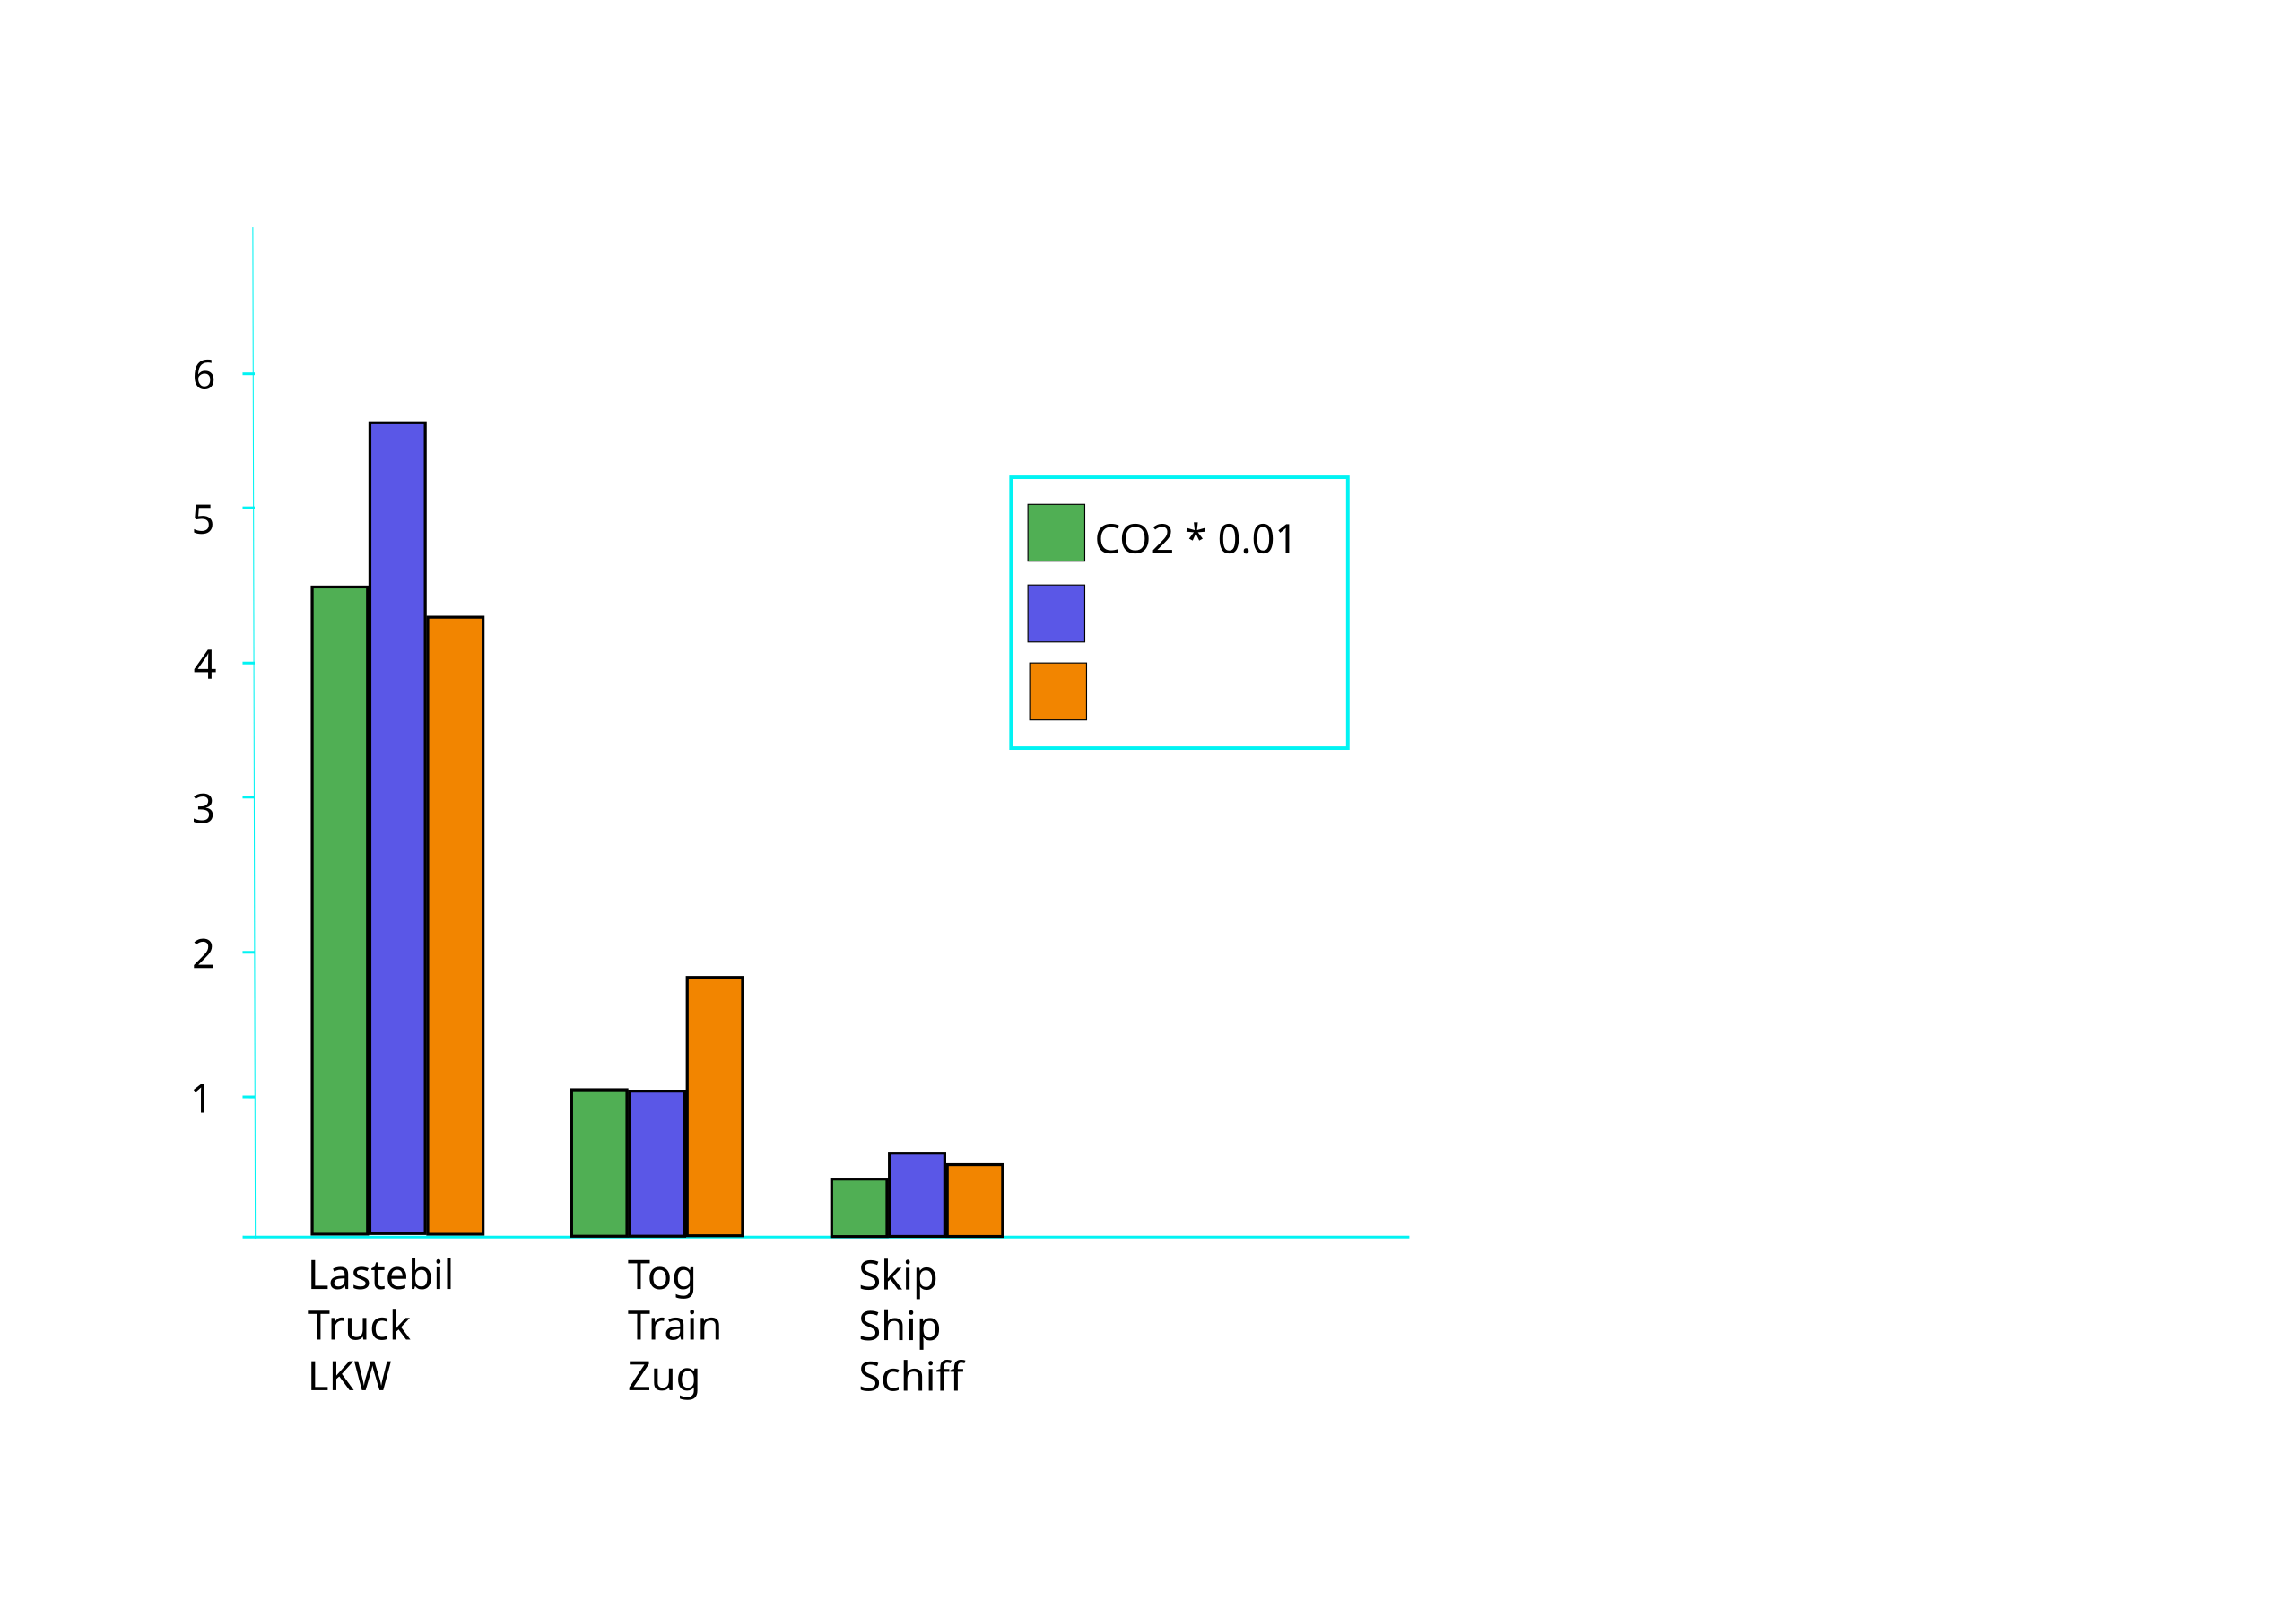
Bar chart showing CO2(*0.01), NOX and SO2(*10) pollution in grams per tonne-kilometer of cargo from truck transport, train transport and ship transportation. Data taken from OECD, The Environmental Effects of Freight http://www.oecd.org/dataoecd/14/3/2386636.pdf |
| Date | 4 December 2005 (original upload date) |
| Source | No machine-readable source provided. Own work assumed (based on copyright claims). |
| Author | No machine-readable author provided. Bertil~commonswiki assumed (based on copyright claims). |
Licensing
[edit]
| I, the copyright holder of this work, release this work into the public domain. This applies worldwide. In some countries this may not be legally possible; if so: I grant anyone the right to use this work for any purpose, without any conditions, unless such conditions are required by law. |
File history
Click on a date/time to view the file as it appeared at that time.
| Date/Time | Thumbnail | Dimensions | User | Comment | |
|---|---|---|---|---|---|
| current | 22:54, 4 December 2005 | | 744 × 524 (18 KB) | Bertil~commonswiki (talk | contribs) | |
| 22:39, 4 December 2005 |  | 744 × 524 (18 KB) | Bertil~commonswiki (talk | contribs) | Bar chart showing NO2, SO2 and CO2 pollution in grams per tonne-kilometer of cargo transportation by truck , train, and ship. Data taken from OECD, The Environmental Effects of Freight http://www.oecd.org/dataoecd/14/3/2386636.pdf Category:Pollution | |
| 22:33, 4 December 2005 |  | 744 × 524 (17 KB) | Bertil~commonswiki (talk | contribs) | Bar chart showing NO2, SO2 and CO2 pollution in grams per tonne-kilometer of cargo from truck transport, train transport and ship transportation. Data taken from OECD, The Environmental Effects of Freight http://www.oecd.org/dataoecd/14/3/2386636.pdf {{ |
You cannot overwrite this file.
File usage on Commons
There are no pages that use this file.