File:UK Income by Age and Gender.png
Jump to navigation
Jump to search

Size of this preview: 800 × 471 pixels. Other resolutions: 320 × 188 pixels | 640 × 376 pixels | 1,024 × 602 pixels | 1,280 × 753 pixels | 2,560 × 1,506 pixels | 4,250 × 2,500 pixels.
Original file (4,250 × 2,500 pixels, file size: 240 KB, MIME type: image/png)
Captions
Captions
Add a one-line explanation of what this file represents
Summary
[edit]
| Description |
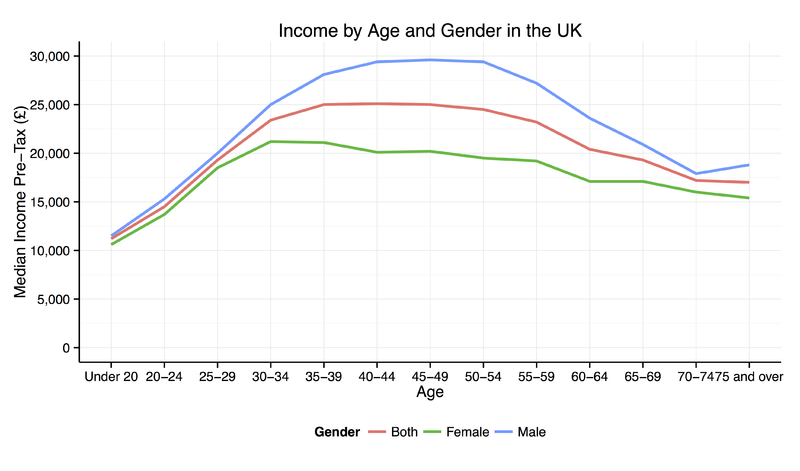
English: Median UK Income by Age and Gender 2012/13
Data from https://www.gov.uk/government/statistics/distribution-of-median-and-mean-income-and-tax-by-age-range-and-gender-2010-to-2011 ("Distribution of median and mean income and tax by age range and gender: 2012 to 2013") |
| Date | |
| Source | Own work |
| Author | D Wells |
Licensing
[edit]
I, the copyright holder of this work, hereby publish it under the following license:
This file is licensed under the Creative Commons Attribution-Share Alike 4.0 International license.
- You are free:
- to share – to copy, distribute and transmit the work
- to remix – to adapt the work
- Under the following conditions:
- attribution – You must give appropriate credit, provide a link to the license, and indicate if changes were made. You may do so in any reasonable manner, but not in any way that suggests the licensor endorses you or your use.
- share alike – If you remix, transform, or build upon the material, you must distribute your contributions under the same or compatible license as the original.
Source code
[edit]
IncomeAge <- structure(list(Age = structure(c(1L, 2L, 3L, 4L, 5L, 6L, 7L,
8L, 9L, 10L, 11L, 12L, 13L, 1L, 2L, 3L, 4L, 5L, 6L, 7L, 8L, 9L,
10L, 11L, 12L, 13L, 1L, 2L, 3L, 4L, 5L, 6L, 7L, 8L, 9L, 10L,
11L, 12L, 13L), .Label = c("Under 20", "20-24", "25-29", "30-34",
"35-39", "40-44", "45-49", "50-54", "55-59", "60-64", "65-69",
"70-74", "75 and over"), class = c("ordered", "factor")), Category = structure(c(1L,
1L, 1L, 1L, 1L, 1L, 1L, 1L, 1L, 1L, 1L, 1L, 1L, 3L, 3L, 3L, 3L,
3L, 3L, 3L, 3L, 3L, 3L, 3L, 3L, 3L, 2L, 2L, 2L, 2L, 2L, 2L, 2L,
2L, 2L, 2L, 2L, 2L, 2L), .Label = c("Both", "Female", "Male"), class = "factor"),
    MedianIncome = c(11200L, 14500L, 19300L, 23400L, 25000L,
    25100L, 25000L, 24500L, 23200L, 20400L, 19300L, 17200L, 17000L,
    11500L, 15300L, 20000L, 25000L, 28100L, 29400L, 29600L, 29400L,
    27200L, 23600L, 20900L, 17900L, 18800L, 10600L, 13700L, 18500L,
    21200L, 21100L, 20100L, 20200L, 19500L, 19200L, 17100L, 17100L,
    16000L, 15400L)), .Names = c("Age", "Category", "MedianIncome"
), row.names = c(NA, -39L), class = "data.frame")

library(ggplot2)
library(scales)

IncomeAge$Age <- factor(IncomeAge$Age,levels=c("Under 20","20-24","25-29","30-34","35-39","40-44","45-49","50-54","55-59","60-64","65-69","70-74","75 and over"),ordered=TRUE)

ggplot(data=IncomeAge,aes(x=Age, y=MedianIncome, colour=Category)) + geom_line(aes(group=Category),size=1) + labs(x="Age", y="Median Income Pre-Tax (£)", title="Income by Age and Gender in the UK", color="Gender")   + theme_minimal() + theme(legend.position="bottom",axis.line = element_line(size = 0.5, linetype = "solid",colour = "black")) + scale_y_continuous(limits=c(0,30000),breaks=c(seq(from=0,to=30000,by=5000)),labels=comma)

ggsave(file="IncomeAge.pdf", width=8.5, height=5)
File history
Click on a date/time to view the file as it appeared at that time.
| Date/Time | Thumbnail | Dimensions | User | Comment | |
|---|---|---|---|---|---|
| current | 21:07, 26 September 2016 | | 4,250 × 2,500 (240 KB) | Cmdrjameson (talk | contribs) | Compressed with pngout. Reduced by 228kB (48% decrease). |
| 17:34, 12 September 2015 |  | 4,250 × 2,500 (469 KB) | D Wells (talk | contribs) | User created page with UploadWizard |
You cannot overwrite this file.
File usage on Commons
There are no pages that use this file.
File usage on other wikis
The following other wikis use this file:
- Usage on en.wikipedia.org
- Usage on es.wikipedia.org