File:UK tax NIC pounds.svg
Jump to navigation
Jump to search

Size of this PNG preview of this SVG file: 512 × 384 pixels. Other resolutions: 320 × 240 pixels | 640 × 480 pixels | 1,024 × 768 pixels | 1,280 × 960 pixels | 2,560 × 1,920 pixels.
Original file (SVG file, nominally 512 × 384 pixels, file size: 282 KB)
Captions
Captions
Add a one-line explanation of what this file represents
Summary[edit]
| Description |
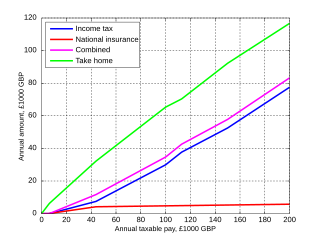
English: Charges to w:UK income tax and w:National Insurance in pounds for the tax year 6 April 2010 thru 5 April 2011. This takes account only of straightforward income tax and Class I employee NICs without contracted-out pension contributions.
Made in w:MATLAB and finished with w:Inkscape. See below for MATLAB source. According to w:HMRC, the tax and National Insurance rates and allowances for 2010/11 are [1]:
|
| Date | |
| Source | Own work |
| Author | Splash |
| Permission (Reusing this file) |
See below. Licensing choices are applicable to both image and MATLAB source code. |
| SVG development | |
| Source code | MATLAB codefunction [it_pounds, it_pct, nic_pounds, nic_pct, total_pounds, total_pct, takehome_pounds] = tax(gross, tax_rates, tax_widths, claw_start, claw_rate, nic_rates, nic_widths, plot_all)
%TAX: Compute the pounds and percentage cost of taxable pay of income tax
%and National Insurance. (Or just tax in places without NI).
%
%[it_pounds it_pct nic_pounds nic_pct total_pounds total_pct takehome_pounds] = tax(gross, tax_rates, tax_widths, nic_rates, nic_widths, plot_all)
%
%Inputs:
% GROSS: Vector of taxable pay amounts to compute all outputs for.
% TAX_RATES: Percentages of tax rates matching entries in tax_widths.
% TAX_WIDTHS: Width in pounds of each tax band, ended by Inf. NOT the
% income levels at which they begin to apply. For example, for 2007-08:
%
% Personal allowance, or 0% band = £5225.
% 10% band = First £2230 taxable = £2230 in width.
% 22% band = £2230 - £34600 taxable = £32370 in width.
% 40% band = £34600 - (unlimited) taxable = £Inf in width.
%
% Therefore, tax_rates and tax_widths are set up as follows:
%
% TAX_RATES = [ 0 10 22 40];
% TAX_WIDTHS = [5225 2230 32370 Inf];
%
% CLAW_START: Value of GROSS at which the clawback of personal allowance
% starts.
% CLAW_RATE: A 2-vector, [PER STEP], where PER is the clawback for each
% increment in GROSS of STEP. E.g. a clawback of £1 for every £2 of GROSS
% is expressed as CLAW_RATE = [1 2].
%
% NIC_RATES: As TAX_RATES. (Omit if no NIC-equivalent needed).
% NIC_WIDTHS: As TAX_WIDTHS. (Omit if no NIC-equivalent needed).
% PLOT_ALL : Single boolean true/false whether to draw the output plot.
%
%Outputs:
% These all have obvious names, and each produce a vector with entries
% corresponding to the entries of input GROSS.
for g = 1:length(gross)
it_pounds(g) = tax_calc(gross(g), tax_rates, tax_widths, claw_start, claw_rate);
it_pct(g) = 100*it_pounds(g)/gross(g);
nic_pounds(g) = tax_calc(gross(g), nic_rates, nic_widths);
nic_pct(g) = 100*nic_pounds(g)/gross(g);
total_pounds(g) = it_pounds(g) + nic_pounds(g);
total_pct(g) = 100*total_pounds(g)/gross(g);
takehome_pounds(g) = gross(g) - total_pounds(g);
end
if exist('plot_all', 'var') && plot_all
%Plots for amounts in pounds
figure;
plot(gross, it_pounds, 'b', gross, nic_pounds, 'r', gross, total_pounds, 'm', gross, takehome_pounds, 'g');
set(get(gca, 'Children'), 'LineWidth',2);
set(gca, 'XMinorTick', 'off', 'YMinorTick', 'on');
legend('Income tax', 'National insurance', 'Combined', 'Take home');
xlabel('Annual taxable pay, GBP');
ylabel('Annual amount, GBP');
grid on;
%Plots for percentages
figure;
plot(gross, it_pct, 'b', gross, nic_pct, 'r', gross, total_pct, 'm');
set(get(gca, 'Children'), 'LineWidth',2);
set(gca, 'XMinorTick', 'off', 'YMinorTick', 'on');
legend('Income tax', 'National insurance', 'Combined');
xlabel('Annual taxable pay, GBP');
ylabel('Percentage of taxable pay');
grid on;
end
%%%%Calculation engine%%%%
function total_tax = tax_calc(gross, rates, widths, claw_start, claw_rate)
tax_band = 1;
income_left = gross;
total_tax = 0;
%Clawback if necessary
if exist('claw_start', 'var') && exist('claw_rate', 'var')
widths(1) = clawback(gross, claw_start, claw_rate, widths(1));
end
while tax_band <= length(widths) && income_left > 0
taxable_this_band = min([widths(tax_band) income_left]);
total_tax = total_tax + taxable_this_band*rates(tax_band)/100;
income_left = income_left - taxable_this_band;
tax_band = tax_band + 1;
end
function new_limit = clawback(gross, claw_start, claw_rate, initial_limit)
%GROSS: Vector of taxable pay amounts to compute all outputs for.
%CLAW_START: Values of GROSS at which the clawback starts
%CLAW_RATE: A 2-vector, [PER STEP], where PER is the clawback for each
%increment in GROSS of STEP. E.g. a clawback of £1 for every £2 of GROSS
%is expressed as CLAW_RATE = [1 2].
%INITIAL_LIMIT: The un-clawedback value to begin with.
%
%NEW_LIMIT is the clawed-back value of INITIAL_LIMIT.
claw_length = max(gross - claw_start, 0);
claw = claw_rate(1) * floor(claw_length/claw_rate(2));
new_limit = max(initial_limit - claw, 0);
</syntaxhighlight>
;For the 20010-11 tax year:
<syntaxhighlight lang="matlab">
tax_rates = [0 20 40 50];
tax_widths = [6475 37400 112600 Inf];
claw_start = 100000;
claw_rate = [1 2];
nic_rates = [0 11 1];
nic_widths = [110*52 (844-110)*52 Inf];
|
Licensing[edit]
The following choices of licensing apply to both the image and also the MATLAB code presented above.
I, the copyright holder of this work, hereby publish it under the following licenses:
This file is licensed under the Creative Commons Attribution-Share Alike 3.0 Unported, 2.5 Generic, 2.0 Generic and 1.0 Generic license.
- You are free:
- to share – to copy, distribute and transmit the work
- to remix – to adapt the work
- Under the following conditions:
- attribution – You must give appropriate credit, provide a link to the license, and indicate if changes were made. You may do so in any reasonable manner, but not in any way that suggests the licensor endorses you or your use.
- share alike – If you remix, transform, or build upon the material, you must distribute your contributions under the same or compatible license as the original.

|
Permission is granted to copy, distribute and/or modify this document under the terms of the GNU Free Documentation License, Version 1.2 or any later version published by the Free Software Foundation; with no Invariant Sections, no Front-Cover Texts, and no Back-Cover Texts. A copy of the license is included in the section entitled GNU Free Documentation License. |
You may select the license of your choice.
See also[edit]
File history
Click on a date/time to view the file as it appeared at that time.
| Date/Time | Thumbnail | Dimensions | User | Comment | |
|---|---|---|---|---|---|
| current | 00:24, 2 May 2010 | | 512 × 384 (282 KB) | Splash (talk | contribs) | updated version for tax year 2010-11 |
| 10:42, 27 April 2009 |  | 522 × 383 (67 KB) | Splash (talk | contribs) | corrected version of 2009-10 | |
| 23:29, 26 April 2009 |  | 520 × 381 (66 KB) | Splash (talk | contribs) | updated for tax year 2009-10 | |
| 23:27, 26 April 2009 |  | 530 × 396 (58 KB) | Splash (talk | contribs) | revision for change to income tax rates announced post-Budget by Chancellor, and backdated to start of tax year for pay dates from 7 Sep 08. | |
| 23:25, 26 April 2009 |  | 532 × 394 (57 KB) | Splash (talk | contribs) | {{Information |Description={{en|1=Tax+NIC pounds for 2008-9. This file will hold versions for future years also.}} |Source=Own work by uploader |Author=Splash |Date=2008-05-16 |Permission= |other_versions= }} <!--{{ImageUpload|full}}--> [ |
You cannot overwrite this file.
File usage on Commons
There are no pages that use this file.
File usage on other wikis
The following other wikis use this file:
- Usage on de.wikipedia.org
- Usage on en.wikipedia.org
- Usage on it.wikipedia.org