File:Sonnenstand.png
Jump to navigation
Jump to search

Size of this preview: 800 × 304 pixels. Other resolutions: 320 × 121 pixels | 640 × 243 pixels | 1,805 × 685 pixels.
Original file (1,805 × 685 pixels, file size: 333 KB, MIME type: image/png)
Captions
Captions
Add a one-line explanation of what this file represents
Infobox[edit]
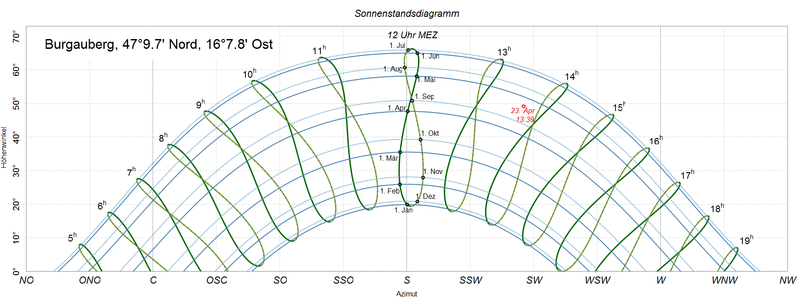
| Description | ein Sonnenstandsdiagramm für Burgauberg, es zeigt für alle vollen Stunden den Sonnenstand an sowie für jeden Monatsersten den Tagesbogen. Außerdem wird der Sonnenstand an einem bestimmten Tag zu einem bestimmten Zeitpunkt braun eingezeichnet |
| Date | |
| Source | made with en:R_Project, see source code below. values of the constants from http://aom.giss.nasa.gov/srorbpar.html formulas from Blatter's paper: http://dz-srv1.sub.uni-goettingen.de/sub/digbib/loader?did=D241775 or http://www.math.ethz.ch/~blatter/Sonnenuhr.pdf |
| Author | Thomas Steiner |
| Permission (Reusing this file) |
Thomas Steiner put it under the CC-by-SA 2.5. |
| Other versions | eg de:Bild:Sonnenstandsdiagramm Wien 300dpi.png |
This file is licensed under the Creative Commons Attribution-Share Alike 2.5 Generic license.
- You are free:
- to share – to copy, distribute and transmit the work
- to remix – to adapt the work
- Under the following conditions:
- attribution – You must give appropriate credit, provide a link to the license, and indicate if changes were made. You may do so in any reasonable manner, but not in any way that suggests the licensor endorses you or your use.
- share alike – If you remix, transform, or build upon the material, you must distribute your contributions under the same or compatible license as the original.
| Camera location | | View this and other nearby images on: OpenStreetMap |
|---|
R-Code[edit]
TODO-list: improve
- real default arguments
- svg file for wikimedia
- global variable for eot=0. different formula?
- automatic xlim (length of longest day)
- check different locations: sun in north at 12?
- find a solution for summertime for the points: is there summertime for a give date at a given location?
- different pagesize for polar and cartesian types. and better pdf size
PNG development
Source code
R code
#to adapt change these eight first lines only
locationname="Burgauberg"
phi=47.162
lambda=16.130
out=""        #""/png/jpg/svg/pdf
type="cart"   #cart/polar
lang="de"     #de/en/it/nl
locale="German_Austria" #month names German_Austria/English/Italian/Dutch
ieqot=F       #F/T (do not take equation of time into account)
summert=0     #1/0 (summertime normal time)

if (lang=="de") {
  ltext=c("N","O","S","W","Nord","Ost","Süd","West","Azimuth","Höhenwinkel","MEZ","MESZ","Uhr","Sonnenstandsdiagramm","Zenit","Horizont")
} else if (lang=="en") {
  ltext=c("N","E","S","W","north","east","south","west","azimuth","elevation angle","CET","CEST","","sun chart","Zenith","Horizon")
} else if (lang=="it") {
  ltext=c("N","E","S","O","Nord","Est","Sud","Ovest","azimut","altezza","CET","CEST","","Diagramma solare","Zenit","Orizzonte")
} else if (lang=="nl") {
  ltext=c("N","O","Z","W","NB","OL","ZB","WL","Azimut","Hoogte","CET","CEST","","Zonnestanddiagram","Zenit","Horizon")
}


phi=phi*pi/180
lambda=lambda*pi/180
KAPPA=0.016700
EPSILON=23.4385*pi/180
ALPHA=(360-283.067)*pi/180  #77.6°
Sys.setlocale("LC_TIME", locale)
library("Cairo")    #for nice plot into files
require("plotrix")  #for polar plots (and other stuff?)
require("geonames") #to find the perfect timezone
TZ=as.numeric(GNtimezone(phi*180/pi,lambda*180/pi)[3])  #manual: round((lambda*180/pi)/15)
if (!exists(x="TZ",mode="numeric")) {
  TZ=round((lambda*180/pi)/15)
}
h=function(t,KAPPA=KAPPA,EPSILON=EPSILON,ALPHA=ALPHA) {
  return( sin(t+delta(t,KAPPA)-ALPHA)*sin(EPSILON) )
}

r=function(t,KAPPA=KAPPA,EPSILON=EPSILON,ALPHA=ALPHA) {
  return( sqrt(1-h(t,KAPPA,EPSILON,ALPHA)^2) )
}

mu=function(t,ignore=F,KAPPA=KAPPA,EPSILON=EPSILON,ALPHA=ALPHA) {
  zaehl=-sin(delta(t,KAPPA))+tan(EPSILON/2)^2*sin(2*(t-ALPHA)+delta(t,KAPPA))
  nenn = cos(delta(t,KAPPA))+tan(EPSILON/2)^2*cos(2*(t-ALPHA)+delta(t,KAPPA))
  if (ignore) { res=0 } else { res=atan(zaehl/nenn) }  #ignore the eq of time
  return( res )
}

delta=function(t,KAPPA=KAPPA) {
  return( 2*KAPPA*sin(t)+5/4*KAPPA^2*sin(2*t) )
}

coords=function(t,S,phi,lambda,ignore=ieqot,KAPPA=KAPPA,EPSILON=EPSILON,ALPHA=ALPHA,tz=TZ) {
  s=pi/180*15*(S+lambda*180/pi/15-tz)
  x1= r(t,KAPPA,EPSILON,ALPHA)*sin(s+mu(t,ignore,KAPPA,EPSILON,ALPHA))
  x2= r(t,KAPPA,EPSILON,ALPHA)*cos(s+mu(t,ignore,KAPPA,EPSILON,ALPHA))*sin(phi)+h(t,KAPPA,EPSILON,ALPHA)*cos(phi)
  x3=-r(t,KAPPA,EPSILON,ALPHA)*cos(s+mu(t,ignore,KAPPA,EPSILON,ALPHA))*cos(phi)+h(t,KAPPA,EPSILON,ALPHA)*sin(phi)
  return(cbind(x1,x2,x3))
}

#returns the angle for sperical coordinates
coord2angle=function(coord,filterout=TRUE) {
  diag=sqrt(coord[,1]^2+coord[,2]^2)
  psi=atan2(coord[,2],coord[,1])
  phi=pi/2-atan(coord[,3]/diag)
  azi=pi/2-psi
  hoeh=pi/2-phi
  azi[azi<0]=azi[azi<0]+2*pi
  if (filterout) {
    hoeh[hoeh<0]=NA
    azi[hoeh<0]=NA
  }
  return( 180/pi*cbind(azi, hoeh) )
  ##hoeh=wasserglas(alpha=hoeh,D=wgD,d=wgd,n1=wgn1,n2=wgn2,n3=wgn3)
  ##return( cbind(azi*180/pi, hoeh) )
}

#transforms an angle to a formated date
angle2date=function(w){
  day=(w/(2*pi))*365
  dates=as.Date("2009-01-01")+day
  if (lang=="de"){
  fdate=format(dates, format="%d. %b")
  } else {
  fdate=format(dates, format="%d %b")
  }
return( fdate )
}

#gets the coordinates and returns a nice desciptive string
location=function(long,lat,name) {
  long=long*180/pi
  if (long<0) { longStr=ltext[8] } else { longStr=ltext[6] }
  lon1=trunc(long+0.00001) #to avoid output 14°60' for 15°0'
  lon2=60*(long-lon1)
  lat=lat*180/pi
  if (lat <0) { latStr =ltext[7] } else { latStr=ltext[5] }
  lat1=trunc(lat+0.00001) #to avoid output 14°60' for 15°0'
  lat2=60*(lat-lat1)
  latlon=paste(abs(lat1),"°",abs(round(lat2,digits=1)),as.character("' "),latStr,", ",abs(lon1),"°",abs(round(lon2,1)),as.character("' "),longStr,sep="")
  string=paste(name,latlon,sep=", ")
  return(string)
}

#Analemma for all hours
analemmabogen=function(suntype="cart",phi=phi,lambda=lambda,KAPPA=KAPPA,EPSILON=EPSILON,ALPHA=ALPHA) {
  jz=seq(0,2*pi,length=365*2)-9/365*2*pi
  sz=seq(0,23,by=1)
  for (si in 1:length(sz)) {
    ko=coords(t=jz,S=sz[si],phi=phi,lambda=lambda,ignore=ieqot,KAPPA=KAPPA,EPSILON=EPSILON,ALPHA=ALPHA,tz=TZ)
    ang=coord2angle(ko,filterout=TRUE)

    mitte=ceiling(length(jz)/2)
    sunlines(suntype=type,x=ang[1:mitte,1],y=ang[1:mitte,2],type="l",lwd=3,col="darkgreen")
    if (!ieqot) { sunlines(suntype=type,x=ang[mitte:length(jz),1],y=ang[mitte:length(jz),2],type="l",col="olivedrab",lwd=2,lty="dotdash") }

    #labels of the full hour markers
    stui=substitute(szsi^{h},list(szsi=sz[si]+summert))
    yl=ang[mitte,2]+2.5
    if(sz[si]==12) {
      if(summert==1) { sozeText=ltext[12] } else { sozeText=ltext[11] }
      stui=paste(12+summert,"h ",ltext[13]," ",sozeText,sep="")
      if (suntype=="cart") {
        yl=ang[mitte,2]+4
      } else if (suntype=="polar") {
        yl=ang[mitte,2]+7
      }
    }
    if (suntype=="cart") {
      text(x=1.025*ang[mitte,1]-4,y=yl,labels=stui,cex=1.7,font=2)
    } else if (suntype=="polar") {
      text(x=(90-yl)*sin((1.025*ang[mitte,1]-4)*pi/180),y=(90-yl)*cos((1.025*ang[mitte,1]-4)*pi/180),labels=stui,cex=1.3,font=2)
    }
  }
}

#arc of the sun at one date for different days within a year
tagesbogen=function(suntype=type,jahr,lty="solid",lwd=2,col="steelblue",phi=phi,lambda=lambda,KAPPA=KAPPA,EPSILON=EPSILON,ALPHA=ALPHA) {
  tag=seq(0,24,length=24*60+1)
  for (jt in 1:length(jahr)) {
    tagbogen=coords(t=jahr[jt],S=tag,phi=phi,lambda=lambda,ignore=ieqot,KAPPA=KAPPA,EPSILON=EPSILON,ALPHA=ALPHA,tz=TZ)
    tagb=coord2angle(tagbogen,filterout=TRUE)
    sunlines(suntype=suntype,x=tagb[,1],y=tagb[,2],lty=lty,lwd=lwd,col=col)
  }
}

#highlight the position of the sun on a specific date and time as a red point
highlightpoint=function(suntype="cart",timeofday,date="2009-05-01",phi=phi,lambda=lambda,shift=c(0,-3),col="red",KAPPA=KAPPA,EPSILON=EPSILON,ALPHA=ALPHA,summert=0) {
  reddate=as.Date(date)
  dayofyear=as.numeric(reddate-as.Date("2009-01-01"))
  co=coords(t=dayofyear/365*2*pi,S=timeofday,phi=phi,lambda=lambda,ignore=ieqot,KAPPA=KAPPA,EPSILON=EPSILON,ALPHA=ALPHA,tz=TZ)
  winkel=coord2angle(co,filterout=TRUE)
  sunlines(suntype=type,x=winkel[,1],y=winkel[,2],type="p",lwd=2,col=col)
  if(summert==1) { timeofday=timeofday+1 }
  minofday=formatC(round((timeofday-floor(timeofday))*60), digits=0, width=2, format="f", flag="0")
  timestring=paste(floor(timeofday),":",minofday,sep="")
  if (suntype=="cart") {
    text(winkel+shift,paste(format(reddate,"%d. %b"),"\n",timestring),col=col,cex=1.4,adj=c(0.5,0.5))
  } else if (suntype=="polar") {
    pwinkel=winkel+shift
    text(x=(90-pwinkel[2])*sin(pwinkel[1]*pi/180),y=(90-pwinkel[2])*cos(pwinkel[1]*pi/180),paste(format(reddate,"%d. %b"),"\n",timestring),col=col,cex=1,adj=c(0.5,0.5))
  }
  print(winkel)
  return(winkel)
}

#function that handles both polar and cartesian coordinates
sunlines=function(suntype,x,y=NULL,...) {
  if (suntype=="cart") {
    lines(x,y, ...)
  } else if (suntype=="polar") {
    lines( x=(90-y)*sin(x*pi/180),y=(90-y)*cos(x*pi/180), ...)
  }
}

filename=paste("Sunchart-",type,"-",lang,"-",locationname,".",out,sep="")
if (out=="png") {
  CairoPNG(file=filename,width=1850,height=690)
  #png(file=filename,width=1850,height=690)
  #bitmap(file=filename,type="png16m",width=1850,height=690)
} else if (out=="pdf") {
  pdf(file=filename,paper="a4r",width=0,height=0)
  ##pdf(file=filename,width=(wgD+2*wgd)*pi/2.54,height=5/2.54)
} else if (out=="jpg") {
  #CairoJPEG(file=filename,width=1850,height=690)
  jpeg(file=filename,width=1850,height=690,quality=98)
} else if (out=="svg") {
  CairoSVG(file=filename,width=11,height=11)
}
xlab=c(paste(ltext[1],sep=""),paste(ltext[1],ltext[1],ltext[2],sep=""),paste(ltext[1],ltext[2],sep=""),paste(ltext[2],ltext[1],ltext[2],sep=""),paste(ltext[2],sep=""),paste(ltext[2],ltext[3],ltext[2],sep=""),paste(ltext[3],ltext[2],sep=""),paste(ltext[3],ltext[3],ltext[2],sep=""),paste(ltext[3],sep=""),paste(ltext[3],ltext[3],ltext[4],sep=""),paste(ltext[3],ltext[4],sep=""),paste(ltext[4],ltext[3],ltext[4],sep=""),paste(ltext[4],sep=""),paste(ltext[4],ltext[1],ltext[4],sep=""),paste(ltext[1],ltext[4],sep=""),paste(ltext[1],ltext[1],ltext[4],sep=""),paste(ltext[1],sep="") )

if (type=="cart") {
  plot(c(0,0),c(0,0),type="n",xlim=c(45,315),ylim=c(0,min(90-phi*180/pi+31,90)),xaxs="i",yaxs="i", axes=FALSE, main=ltext[14], cex.main=2.3, font.main=2, xlab=ltext[9], ylab=ltext[10], cex.lab=1.33)
  ##par(mar=c(0,0,0,0),cex=0.33)
  ##plot(c(0,0),c(0,0),type="n",xlim=c(0,360),ylim=c(-5,0),xaxs="i",yaxs="i", axes=FALSE)
  ##box("figure", col="blue",lwd=2)
  #par(mai=c(0.95625,0.76875,0.76875,0.39375))
  #box("figure", col="blue")
  legend(x=45,y=min(90-phi*180/pi+31,90),legend=location(lat=phi,long=lambda,name=locationname),box.col="white",bg="white",cex=1.7)


  xticks=seq(par("usr")[1],par("usr")[2],by=22.5)
  yticks=seq(par("usr")[3],par("usr")[4],by=10)
  axis(1, at=xticks[1:length(xticks)], tick=F, cex.axis=1.33, labels=xlab[3:15],font=2)
  ##axis(1, at=xticks[1:length(xticks)], tck=0.01, mgp=c(0,-1.5,0), cex.axis=1.75, labels=xlab[1:length(xticks)],font=2)
  axis(2, at=yticks, tick=F, cex.axis=1.5, labels=paste(yticks,"°",sep=""))
  grid( nx=length(xticks)-1,ny=NA,col="gray75")
  abline( h=yticks, col="gray75", lty="dotted")
  abline( v=c(90,180,270), col="gray20",lty="dotted")

  box(which="plot",col="grey50")
} else if (type=="polar") {
  polar.plot(length=NA,polar.pos=NA,rp.type="p",clockwise=TRUE,label.pos=seq(45,360+22.5,by=22.5),start=135,labels=xlab,radlab=F,radial.labels="",radial.lim=c(0,30,60,90),show.centroid=F, main=ltext[14], cex.main=2.3, font.main=2 )
  text(x=c(0,0,0,0),y=c(0,30,60,90),labels=c(ltext[15],"60°","30°",ltext[16]),col="darkgrey")
  legend("topleft",legend=location(lat=phi,long=lambda,name=locationname),box.col="white",bg="white",cex=1)
}

#arc on a day: birthdays
jahr=c(113)/365*2*pi
tagesbogen(suntype=type,jahr,lty=4,lwd=2,col="orange",phi=phi,lambda=lambda,KAPPA=KAPPA,EPSILON=EPSILON,ALPHA=ALPHA)

analemmabogen(suntype=type,phi=phi,lambda=lambda,KAPPA=KAPPA,EPSILON=EPSILON,ALPHA=ALPHA)

#daily arc: first half of the year
jahr=cumsum(c(0,31,28,31,30,31))/365*2*pi #one line per month
tagesbogen(suntype=type,jahr,lty="solid",lwd=2,col="steelblue",phi=phi,lambda=lambda,KAPPA=KAPPA,EPSILON=EPSILON,ALPHA=ALPHA)

#daily arc: second half of the year
jahr=cumsum(c(181,31,31,30,31,30))/365*2*pi #one line per month
tagesbogen(suntype=type,jahr,lty="dotted",lwd=2,col="skyblue3",phi=phi,lambda=lambda,KAPPA=KAPPA,EPSILON=EPSILON,ALPHA=ALPHA)

#one point per month, each at 12 o'clock
jp=cumsum(c(0,31,28,31,30,31,30,31,31,30,31,30))/365*2*pi #one line per month
jahresbogen=coords(t=jp,S=12,phi=phi,lambda=lambda,ignore=ieqot,KAPPA=KAPPA,EPSILON=EPSILON,ALPHA=ALPHA,tz=TZ)
angl=coord2angle(jahresbogen,filterout=TRUE)
sunlines(suntype=type,x=angl[,1],y=angl[,2],type="p",lwd=2)
adj=cbind(c(0.9,1,1.1,1.1,0,-0.2,1.2,1.1,-0.1,0,0,0.1),c(1.5,1.7,1.6,-0.2,1.3,1,-0.4,0.7,-0.3,-0.7,-0.7,-0.5))
for (i in 1:length(jp)) {
  if (type=="cart") {
    text(x=angl[i,1],y=angl[i,2],angle2date(jp[i]),adj=adj[i,],cex=1.33)
  } else if (type=="polar") {
    text(x=(90-angl[i,2])*sin(angl[i,1]*pi/180),y=(90-angl[i,2])*cos(angl[i,1]*pi/180),angle2date(jp[i]),adj=adj[i,],cex=0.7)
  }
}

#sun location on a certain day and time
hipo=highlightpoint(suntype=type,timeofday=13+25/60,date="2009-04-23",phi=phi,lambda=lambda,shift=c(0,-3),col="brown4",KAPPA=KAPPA,EPSILON=EPSILON,ALPHA=ALPHA,summert=0)

if (out=="png" | out=="jpg" | out=="svg" | out=="pdf") {
  dev.off()
  print(paste("output written to ",getwd(),"/",filename,sep=""))
}

###
###
## ev paar Zeilen rauf schieben, dient für sonneneinstrahlung abzuschätzen
sunlines(suntype=type,x=c(113,113+180),y=c(0,0),type="l",lwd=3,col="red")
# utitlity function to integrate (is sum up) the sun intensity over one day (and then to sum it up over a year)
besonnung_t=function(jahr) {
  tag=seq(0,24,length=60*24+1)
  tagbogen=coords(t=jahr,S=tag,phi=phi,lambda=lambda,ignore=ieqot,KAPPA=KAPPA,EPSILON=EPSILON,ALPHA=ALPHA)
  tagb=coord2angle(tagbogen,filterout=TRUE)
  resu=tagb[,2]
  resu[is.na(resu)]=0
  resu[tagb[,1] < (113.5) ]=0  #SüdWand noch nicht besonnt
  resu[tagb[,1] > (113.5+180) ]=0  #SüdWand nicht mehr besonnt
  return( mean(resu) )
}

# utitlity function to integrate (is sum up) the sun intensity over the whole year)
besonnung_j=function() {
  sonnensumme=0
  jahr=seq(0,2*pi/365,length=365)
  for (jt in 1:length(jahr)) {
    sonnensumme=sonnensumme+besonnung_t(jahr[jt])
  }
  return(sonnensumme/length(jahr))
}

besonnung_t(jahr=c(94)/365*2*pi)
besonnung_j()
###
###
File history
Click on a date/time to view the file as it appeared at that time.
| Date/Time | Thumbnail | Dimensions | User | Comment | |
|---|---|---|---|---|---|
| current | 13:47, 5 July 2009 | 1,805 × 685 (333 KB) | Thire (talk | contribs) | cairoPNG and other minor changes | |
| 12:20, 17 May 2009 | 1,805 × 685 (40 KB) | Thire (talk | contribs) | neue location, better code | ||
| 00:01, 8 November 2008 | 1,805 × 685 (40 KB) | Thire (talk | contribs) | see code and description page for changes | ||
| 18:51, 4 November 2008 | 1,800 × 680 (41 KB) | Thire (talk | contribs) | cols, lty, errors, red point one date/time, details. see descr (code) | ||
| 20:35, 29 October 2008 | 1,800 × 680 (41 KB) | Thire (talk | contribs) | nice red point etc (see desciption page comments) | ||
| 11:55, 26 October 2008 | 1,800 × 680 (43 KB) | Thire (talk | contribs) | now cols etc (see desc comments) | ||
| 20:36, 20 October 2008 | 1,800 × 675 (35 KB) | Thire (talk | contribs) | now image: fat lines etc; new location | ||
| 09:32, 19 October 2008 | 2,000 × 750 (44 KB) | Thire (talk | contribs) | now the new image... | ||
| 14:43, 18 October 2008 | 1,480 × 530 (29 KB) | Thire (talk | contribs) | {{Information |Description= |Source= |Date= |Author= |Permission= |other_versions= }} | ||
| 00:53, 18 October 2008 | 1,500 × 520 (27 KB) | Thire (talk | contribs) | {{Information |Description={{en|1=d}} {{de|1=d}} |Source=d |Author=d |Date= |Permission= |other_versions= }} <!--{{ImageUpload|full}}--> |
You cannot overwrite this file.
File usage on Commons
There are no pages that use this file.
File usage on other wikis
The following other wikis use this file:
- Usage on de.wikipedia.org
- Usage on fr.wikipedia.org