Phase diagram
Zur Navigation springen
Zur Suche springen
A phase diagram in physical chemistry, mineralogy, and materials science is a type of graph used to show the equilibrium conditions between the thermodynamically-distinct phases. In mathematics and physics, a phase diagram also has an alternative meaning, as a synonym for a phase space.
States of a pure body[Bearbeiten]
-

-
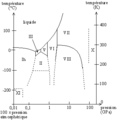
 Phase diagram of w:en:solid oxygen
 -
 Ice phase diagram in French; read the warning in the description page
 -


Binary or ternary phase diagram[Bearbeiten]
-
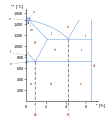
 water+salt mix in French
 -

-

-

-
 Fe-C phase diagram of carbon steel in English
 -
 Fe-C phase diagram of carbon steel in Basque. Easy to translate .svg file.
 -
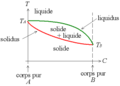 Ideal case of binary phase diagram: unique solid solution
 -
 typical evaporation diagram in lense-shape (German)
 -
 International version of iron-carbon phase diagram
 -

-
 Phase diagram of tetrahydrofurane (THF) with water
 -
 Phase diagrams of tetrahydrofurane (THF) with methanol, ethanol, 1-propanol and 2-propanol
 -
 Phase diagram of hydrogen chloride with water (hydrochloric acid)
 -
 Phase diagram of hydrogen chloride with water (hydrochloric acid)


Evolution of parameters during transformations[Bearbeiten]
-
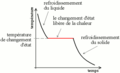 temperature vs. time during solidification, passive cooling
 -
 system to measure the volume changes vs. pressure and temperature
 -
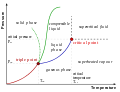
 (P, V, T) phase diagram
 -
 (P, V, T) phase diagram and (V, P) Clapeyron isothermal diagram
 -
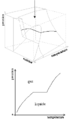
 (P, V, T) phase diagram and (V, T) states diagram
 -
 (P, V, T) phase diagram and (V, T) isobaric diagram


.fr.svg)


Unsorted[Bearbeiten]
-
 Dehydration processes

.png)