Category:2100
Vai alla navigazione
Vai alla ricerca
| ◀ 2100s ▶ (XXI secolo, III millennio) |
|---|
| ◀ 2100 · 2101 · 2102 · 2103 · 2104 · 2105 · 2106 · 2107 · 2108 · 2109 ▶ |

anno | |||||
| Carica un file multimediale | |||||
| Istanza di |
| ||||
|---|---|---|---|---|---|
| Parte di | |||||
| Consiste di |
| ||||
| Data |
| ||||
| Data di inizio |
| ||||
| Data di fine |
| ||||
| Preceduto da | |||||
| Seguito da | |||||
| |||||
Sottocategorie
Questa categoria contiene le 5 sottocategorie indicate di seguito, su un totale di 5.
*
File nella categoria "2100"
Questa categoria contiene 59 file, indicati di seguito, su un totale di 59.
-
 China population pyramid from 2023 to 2100.gif 1 200 × 985; 3,17 MB
-
-
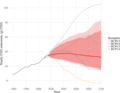
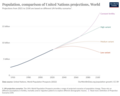 Comparison-of-world-population-projections.png 3 400 × 2 706; 552 KB
-

-

-

-
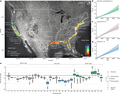
 Earth-humanity planetary vital signs.jpg 1 725 × 1 750; 632 KB
-
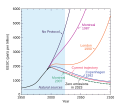 Effect of the Montreal Protocol.svg 600 × 550; 12 KB
-
 Excess skin cancer cases due to ozone depletion, OWID.svg 850 × 600; 6 KB
-
 Excess-skin-cancer-cases-due-to-ozone-depletion.png 3 400 × 2 400; 338 KB
-

-
 Future greenhouse gas emission scenarios, OWID.svg 850 × 600; 22 KB
-
 Global aging demographics.webp 1 946 × 894; 96 KB
-

-

-

-

-

-

-
 Global sea level rise projections 2000-2100.png 1 066 × 692; 11 KB
-
 Greenhouse-gas-emission-scenarios-01.png 2 041 × 1 422; 184 KB
-
 Hassan 2022 AMOC aerosols.png 1 143 × 644; 216 KB
-
 Historical population of India and China.svg 850 × 600; 49 KB
-
 IPCC AR6 WGI — Global surface temperature change relative to 1850–1900.png 1 840 × 1 018; 103 KB
-

-
 Median age of the United Kingdom overtime and projections.svg 850 × 600; 28 KB
-
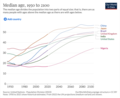 Median Age, 1950-2100.png 1 248 × 1 024; 186 KB
-

-
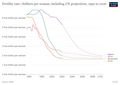
 Number of children under 5 years old, OWID.svg 850 × 600; 22 KB
-
 Population by age bracket with UN projections, OWID.svg 850 × 600; 28 KB
-
 Population by broad age group projected to 2100, OWID.svg 850 × 600; 33 KB
-
 Population growth rate (UN (1950 to 2100)), OWID.svg 850 × 600; 140 KB
-
 Population projections of France by the UN up to 2100.svg 850 × 600; 35 KB
-
 Population pyramid of Japan from 2020 to 2100.gif 1 200 × 995; 420 KB
-
 Population pyramid of Russia from 2020 to 2100.gif 1 200 × 995; 497 KB
-
 Population pyramid of South Korea from 2020 to 2100.gif 1 200 × 995; 483 KB
-
 Population pyramid of the United States from 2000 to 2100.gif 1 200 × 976; 757 KB
-
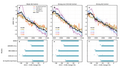
 Probabilistic global temperature forecast and validation.webp 1 922 × 717; 46 KB
-
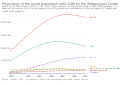
 Projected change in under-5 population from 2050 to 2100, OWID.svg 850 × 600; 140 KB
-

-

-
-
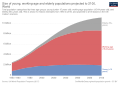
 The growth of the world population to 2100, by age group, OWID.svg 850 × 600; 11 KB
-
-
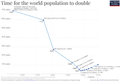 Time for the World population to double 1534 – 2100.png 6 122 × 4 136; 536 KB
-
 Top 3 countries' projected population.svg 850 × 600; 33 KB
-
 Total Fertility Rate for 6 Regions and the World, 1950-2100, UN2022.svg 1 989 × 2 127; 29 KB
-
 Total fertility rate, globally and by GBD super-region, 1950–2100.jpg 2 853 × 1 859; 570 KB
-
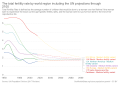
 Total-fertility-rate-including-un-projections-through-2100.png 3 400 × 2 400; 465 KB
-
 UK population pyramid projections up to 2100.gif 1 200 × 1 062; 3,02 MB
-
 UN population estimates and projection 1950-2011.png 1 022 × 674; 109 KB
-
-

-

-
-
 World Population Growth 1700-2100.png 3 057 × 2 179; 244 KB
-
 World population growth, 1700-2100, 2022 revision.png 13 083 × 9 584; 1,46 MB
-
 World population projections. United Nations.png 1 832 × 1 324; 112 KB
-
 World-Population-Growth-1750-2100.png 3 000 × 2 100; 236 KB

.webp)


_in_present_(2020)_and_future_climates.webp)


),_OWID.svg)


,_OWID.svg)

),_OWID.svg)


