Category:Air quality monitoring
Zur Navigation springen
Zur Suche springen
Beschaffenheit der Luft bezogen auf den Anteil der Luftverunreinigungen  Air quality monitoring station in Perugia, Italy (2012) | |||||
| Medium hochladen | |||||
| Unterklasse von |
| ||||
|---|---|---|---|---|---|
| |||||
Unterkategorien
Es werden 13 von insgesamt 13 Unterkategorien in dieser Kategorie angezeigt:
In Klammern die Anzahl der enthaltenen Kategorien (K), Seiten (S), Dateien (D)
*
- Outdoor air quality (41 D)
A
- Air microbiology (3 D)
- Air sampling pods (17 D)
D
G
- Global Air Sampling Program (108 D)
M
Medien in der Kategorie „Air quality monitoring“
Folgende 63 Dateien sind in dieser Kategorie, von 63 insgesamt.
-
 2015 Air pollution in Beijing.svg 926 × 264; 4,9 MB
-
 2016 Air pollution in Beijing.svg 926 × 254; 4,96 MB
-
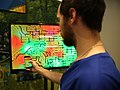 Adam Laskowitz demonstrates smartphone air quality app.jpg 1.920 × 1.441; 228 KB
-
 Air Monitoring Station, Brighton Beach, Windsor (3902118473).jpg 1.200 × 900; 878 KB
-
 Air pollution sensor at Birmingham New Street train station.jpg 800 × 600; 127 KB
-
 Air Quality Egg.png 501 × 349; 276 KB
-
 Air Quality Index.pdf 1.275 × 1.350, 12 Seiten; 333 KB
-
 Air Quality Monitoring on Sierra National Forest (4546851916).jpg 1.712 × 2.288; 749 KB
-
 Air Quality Monitoring Station behind SSC.jpg 2.322 × 4.128; 3 MB
-
 Air Quality Monitoring Station.jpg 1.921 × 1.944; 930 KB
-
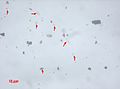 Airborne spores.jpg 2.080 × 1.536; 2,01 MB
-
 AirQualityLondon1.jpg 1.618 × 2.155; 1,5 MB
-
 Beta attenuation detector.svg 829 × 786; 68 KB
-
 Biostation.jpg 2.848 × 4.288; 1,7 MB
-

-

-
 Blue Grass Chemical Agent-Destruction Pilot Plant Safety Rodeo (28259292608).jpg 2.278 × 2.278; 3,2 MB
-

-
 Carbon monoxide detector.jpg 1.269 × 1.188; 419 KB
-
 Chacaltaya observatory InletsGAW 2014.jpg 2.448 × 1.624; 1 MB
-
-
 Cpc-my.svg 375 × 552; 47 KB
-
CTC25 Aberdeen AIr Quality.webm 11 min 42 s, 1.920 × 1.080; 110,6 MB
-

-
 Driven by Sustainability (49985003008).png 2.176 × 1.862; 4,44 MB
-
 East particulate & VOC monitors (7789011540).jpg 1.024 × 575; 153 KB
-
 EPA Summa Canisters (4717896860).jpg 800 × 600; 89 KB
-
 Feuille de tabac nécrosée.JPG 2.272 × 1.704; 904 KB
-
 Figure 1-.png 795 × 548; 1,06 MB
-
 FINN emissions over the Saddleworth Moor region.jpg 1.725 × 1.431; 173 KB
-
 Flagship air monitoring station in Beirut.jpg 4.000 × 3.000; 2,26 MB
-
 Hava Kalitesi İzleme İstasyonu.jpg 2.835 × 3.780; 1,39 MB
-
 IAQ measurment unit.jpg 2.079 × 2.448; 978 KB
-
 Ionenkonzentration Aussenraumluft.png 4.096 × 2.895; 287 KB
-
 Ionenkonzentration Vergleich Innenraum Aussenraum.png 4.096 × 2.895; 386 KB
-
 Langfang air quality from 2014-2018.png 862 × 371; 46 KB
-
 Malaysian Haze 2005 Aerosol Index.jpg 800 × 775; 83 KB
-

-
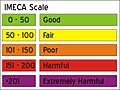 MexicoCityImecaScale.JPG 390 × 292; 32 KB
-
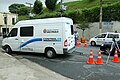 Monitoramentodepoluicaoveicular.jpg 1.500 × 1.000; 266 KB
-

-

-

-

-

-
 South particulate & VOC monitors (7789010494).jpg 1.024 × 575; 154 KB
-
 Southwest particulate & VOC monitors (7789010308).jpg 1.024 × 575; 154 KB
-
 Stratum Purge & Trap Concentratorl.jpg 259 × 350; 62 KB
-
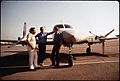 THIS PLANE, SUPPLIED BY NASA IS EQUIPPED TO UNDERTAKE SMOG RESEARCH - NARA - 542669.jpg 3.000 × 2.036; 3,74 MB
-

-
 Top 10 global cities where air pollution has increased and decreased the most since 2019.png 2.401 × 3.614; 1,03 MB
-
 Top 10 US cities where air pollution has increased and decreased the most since 2019.png 2.401 × 3.614; 964 KB
-
 Transparent Background.png 592 × 140; 20 KB
-

-

-
 Turn by turn directions to clearner air on smartphone.jpg 1.920 × 1.440; 177 KB
-
 US DoS air quality index New Delhi June 2-17 2018.png 720 × 300; 27 KB
-
 US PM2.5 Standards and Air Quality Index.jpg 640 × 334; 72 KB
-
 Viena, varios 1988 11.jpg 667 × 1.030; 647 KB
-
 Wiener Luftbewertung.jpg 2.144 × 896; 854 KB
-
 Sensing change-ringelmann smoke charts.jpg 998 × 799; 575 KB
-
 Viktor Meyer vapor density apparatus prop 103abc.jpg 750 × 563; 110 KB
-
 Wilma Theatre 2013 Particle Falls 004.JPG 5.760 × 3.840; 7,67 MB

.jpg)


.jpg)


.jpg)
.jpg)
.jpg)


.svg)


.png)
.jpg)
.jpg)


.jpg)
.jpg)


.gif)
.gif)


