Category:Cluster analysis
Vai alla navigazione
Vai alla ricerca
insieme di tecniche volte alla selezione e raggruppamento di dati  | |||||
| Carica un file multimediale | |||||
| Sottoclasse di |
| ||||
|---|---|---|---|---|---|
| Parte di | |||||
| Aspetto di | |||||
| Uso |
| ||||
| |||||
Sottocategorie
Questa categoria contiene le 5 sottocategorie indicate di seguito, su un totale di 5.
Pagine nella categoria "Cluster analysis"
Questa categoria contiene un'unica pagina, indicata di seguito.
File nella categoria "Cluster analysis"
Questa categoria contiene 195 file, indicati di seguito, su un totale di 195.
-
 10 תמונה.jpg 565 × 327; 44 KB
-
 4 תמונה.jpg 112 × 99; 3 KB
-
-
-
-
-
-
-
-
-
-
-
-
-
-
-
-
-
-
-
-
-
-
-
-
-
Calcium-imaging-of-sleep–wake-related-neuronal-activity-in-the-dorsal-pons-ncomms10763-s2.ogv 38 s, 514 × 294; 4,04 MB
-
Calcium-imaging-of-sleep–wake-related-neuronal-activity-in-the-dorsal-pons-ncomms10763-s3.ogv 28 s, 514 × 294; 1,33 MB
-
-
 Cluster-1.gif 601 × 402; 2 KB
-
 Cluster-1.svg 601 × 402; 2 KB
-
 Cluster-2.png 601 × 402; 1 KB
-
 Cluster-2.svg 601 × 402; 2 KB
-
 ClusterAnalysis Mouse de.svg 1 355 × 547; 305 KB
-
 ClusterAnalysis Mouse.svg 1 355 × 547; 308 KB
-
 Clustering nutrients01.png 666 × 667; 21 KB
-
 Clustering nutrients02.png 671 × 672; 25 KB
-
 Clusters.PNG 266 × 260; 15 KB
-
 Clusters.svg 250 × 251; 9 KB
-
 Clustersgeometricos.jpg 637 × 333; 13 KB
-
 Clustezinho.jpg 576 × 371; 18 KB
-
-
-
 Complete linkage Dendrogram 5S data.svg 1 061 × 531; 18 KB
-
-
-
 DataClustering ElbowCriterion.JPG 355 × 266; 12 KB
-
 DBSCAN-density-data.svg 320 × 322; 77 KB
-
 DBSCAN-Gaussian-data.svg 434 × 467; 407 KB
-
 DBSCAN-Illustration.svg 165 × 119; 13 KB
-
 Decision stream.gif 1 750 × 1 742; 116 KB
-
-
-
-
 Different types of biclusters.jpg 1 152 × 576; 33 KB
-
Dynamic-Conformational-Changes-in-MUNC18-Prevent-Syntaxin-Binding-pcbi.1001097.s005.ogv 0,0 s, 1 152 × 784; 20,28 MB
-
 Elbow in Inertia on uniform data.png 882 × 468; 23 KB
-
Electroencephalographic-Brain-Dynamics-Following-Manually-Responded-Visual-Targets-pbio.0020176.v001.ogv 7,3 s, 640 × 480; 1 001 KB
-
 EM Clustering of Old Faithful data.gif 360 × 309; 113 KB
-
 Em old faithful.gif 360 × 360; 272 KB
-
 EM-density-data.svg 434 × 467; 322 KB
-
 EM-Gaussian-data.svg 434 × 467; 413 KB
-
Evolution-of-Collective-Behaviors-for-a-Real-Swarm-of-Aquatic-Surface-Robots-pone.0151834.s002.ogv 45 s, 1 920 × 1 080; 9,2 MB
-
-
-
-
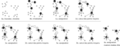
 Example 1 KHOPCA.png 719 × 724; 69 KB
-
Family-based-clusters-of-cognitive-test-performance-in-familial-schizophrenia-1471-244X-4-20-S5.ogv 0,8 s, 656 × 704; 1,49 MB
-
-
 GaussienChevauche1.gif 960 × 560; 8 KB
-
 GaussienChevauche2.gif 960 × 560; 11 KB
-
Gene-expression-profiles-in-skeletal-muscle-after-gene-electrotransfer-1471-2199-8-56-S10.ogv 35 s, 320 × 240; 6,28 MB
-
Gene-expression-profiles-in-skeletal-muscle-after-gene-electrotransfer-1471-2199-8-56-S11.ogv 21 s, 320 × 240; 2,95 MB
-
Gene-expression-profiles-in-skeletal-muscle-after-gene-electrotransfer-1471-2199-8-56-S12.ogv 35 s, 320 × 240; 5,21 MB
-
Gene-expression-profiles-in-skeletal-muscle-after-gene-electrotransfer-1471-2199-8-56-S13.ogv 15 s, 320 × 240; 2,54 MB
-
Gene-expression-profiles-in-skeletal-muscle-after-gene-electrotransfer-1471-2199-8-56-S14.ogv 35 s, 320 × 240; 5,22 MB
-
Gene-expression-profiles-in-skeletal-muscle-after-gene-electrotransfer-1471-2199-8-56-S15.ogv 8,9 s, 320 × 240; 1,53 MB
-
Gene-expression-profiles-in-skeletal-muscle-after-gene-electrotransfer-1471-2199-8-56-S16.ogv 35 s, 320 × 240; 5,35 MB
-
Gene-expression-profiles-in-skeletal-muscle-after-gene-electrotransfer-1471-2199-8-56-S17.ogv 12 s, 320 × 240; 2,1 MB
-
Gene-expression-profiles-in-skeletal-muscle-after-gene-electrotransfer-1471-2199-8-56-S18.ogv 35 s, 320 × 240; 5,41 MB
-
Gene-expression-profiles-in-skeletal-muscle-after-gene-electrotransfer-1471-2199-8-56-S19.ogv 11 s, 320 × 240; 2,14 MB
-
Gene-expression-profiles-in-skeletal-muscle-after-gene-electrotransfer-1471-2199-8-56-S4.ogv 35 s, 320 × 240; 6,35 MB
-
Gene-expression-profiles-in-skeletal-muscle-after-gene-electrotransfer-1471-2199-8-56-S5.ogv 15 s, 320 × 240; 2,32 MB
-
Gene-expression-profiles-in-skeletal-muscle-after-gene-electrotransfer-1471-2199-8-56-S6.ogv 35 s, 320 × 240; 6,26 MB
-
Gene-expression-profiles-in-skeletal-muscle-after-gene-electrotransfer-1471-2199-8-56-S7.ogv 18 s, 320 × 240; 2,77 MB
-
Gene-expression-profiles-in-skeletal-muscle-after-gene-electrotransfer-1471-2199-8-56-S8.ogv 35 s, 320 × 240; 6,22 MB
-
Gene-expression-profiles-in-skeletal-muscle-after-gene-electrotransfer-1471-2199-8-56-S9.ogv 19 s, 320 × 240; 2,84 MB
-
Global-local-and-focused-geographic-clustering-for-case-control-data-with-residential-histories-1476-069X-4-4-S2.ogv 19 s, 1 280 × 1 024; 1,54 MB
-
-
 GLPK solution of a clustering problem.svg 1 200 × 1 200; 108 KB
-
-
-
 Hierarchical1.jpg 410 × 209; 18 KB
-
 IdentifiabilityZones.pdf 1 500 × 1 500; 231 KB
-
 Illustration de l'algorithme K-Moyenne basé distance.gif 450 × 505; 17 KB
-
 Illustration K-moyenne centré réduit 1.gif 300 × 200; 10 KB
-
 Illustration K-moyenne centré réduit 2.gif 360 × 170; 9 KB
-
In-vitro-discovery-of-promising-anti-cancer-drug-combinations-using-iterative-maximisation-of-a-srep14118-s5.ogv 12 s, 1 920 × 1 080; 3,29 MB
-
In-vitro-discovery-of-promising-anti-cancer-drug-combinations-using-iterative-maximisation-of-a-srep14118-s6.ogv 12 s, 1 920 × 1 080; 6,59 MB
-
In-vitro-discovery-of-promising-anti-cancer-drug-combinations-using-iterative-maximisation-of-a-srep14118-s7.ogv 12 s, 1 920 × 1 080; 3,44 MB
-
 Iris silhouette.svg 630 × 630; 325 KB
-
 K-means centre force.gif 360 × 430; 12 KB
-
 K-means convergence.gif 637 × 619; 499 KB
-
 K-means steg 1.svg 512 × 534; 6 KB
-
 K-means steg 2.svg 512 × 534; 7 KB
-
 K-means steg 3.svg 512 × 534; 13 KB
-
 K-means steg 4.svg 512 × 535; 8 KB
-
 K-means.png 9 350 × 3 567; 1,37 MB
-
 K-Medoids Clustering.gif 756 × 756; 154 KB
-
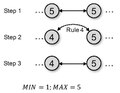 KHOPCA rule 4.pdf 493 × 383; 28 KB
-
-
-
-
-
-
-
-
-
Live-imaging-and-analysis-of-postnatal-mouse-retinal-development-1471-213X-13-24-S7.ogv 16 s, 1 008 × 326; 2,19 MB
-
 LOF-idea.svg 124 × 130; 8 KB
-
-
Maturation-of-Induced-Pluripotent-Stem-Cell-Derived-Hepatocytes-by-3D-Culture-pone.0086372.s018.ogv 9,1 s, 480 × 480; 998 KB
-
Maturation-of-Induced-Pluripotent-Stem-Cell-Derived-Hepatocytes-by-3D-Culture-pone.0086372.s019.ogv 4,8 s, 512 × 512; 557 KB
-
Maturation-of-Induced-Pluripotent-Stem-Cell-Derived-Hepatocytes-by-3D-Culture-pone.0086372.s020.ogv 4,8 s, 1 024 × 1 024; 741 KB
-
Maturation-of-Induced-Pluripotent-Stem-Cell-Derived-Hepatocytes-by-3D-Culture-pone.0086372.s021.ogv 4,8 s, 1 024 × 1 024; 583 KB
-
Microgravity-simulation-by-diamagnetic-levitation-effects-of-a-strong-gradient-magnetic-field-on-1471-2164-13-52-S2.ogv 10 min 0 s, 640 × 480; 81,26 MB
-
 Minimum spannig tree.jpg 575 × 369; 18 KB
-
-
 Nearest-neighbor chain algorithm animated.gif 300 × 311; 449 KB
-
 Nonbayesian-categorical-mixture.svg 178 × 156; 16 KB
-
 Nonbayesian-gaussian-mixture.svg 186 × 154; 20 KB
-
 Occupied Grids P = 0.24.png 394 × 366; 12 KB
-
 Occupied Grids P = 0.64.png 404 × 378; 14 KB
-
 OPTICS-Gaussian-data.svg 434 × 467; 569 KB
-
 OPTICS.png 350 × 341; 31 KB
-
 OPTICS.svg 712 × 487; 643 KB
-
 Otimalidadedoalgoritmo.jpeg 700 × 400; 23 KB
-
 PACexplained.png 720 × 540; 70 KB
-
Plasticity-of-Blood--and-Lymphatic-Endothelial-Cells-and-Marker-Identification-pone.0074293.s002.ogv 23 s, 1 280 × 720; 2,88 MB
-
 Primsdem.jpg 700 × 400; 7 KB
-
 Principal tree for Iris data set.png 1 240 × 720; 36 KB
-
-
 RDQGif.gif 461 × 560; 6 KB
-
 Reachability-distance.svg 124 × 130; 6 KB
-
 RedeCentral.png 609 × 298; 42 KB
-
 RedeFragmentada.png 553 × 291; 28 KB
-
 RedeMaiorDiametro.png 562 × 201; 25 KB
-
 School cluster.png 4 096 × 4 096; 5,79 MB
-
-
-
-
-
 Simple linkage-5S.svg 776 × 584; 2 KB
-
 Single linkage.png 899 × 537; 17 KB
-
 Singlelink.jpg 437 × 172; 9 KB
-
 Singlelinkage.jpg 190 × 163; 3 KB
-
 SLINK-density-data.svg 434 × 467; 445 KB
-
 SLINK-Gaussian-data.svg 434 × 467; 572 KB
-
 Spatial genetic structure of walnuts population.png 2 242 × 1 055; 822 KB
-
-
 Specclus irisknn1.svg 900 × 900; 4,81 MB
-
 Spectral clustering vs k means.png 4 000 × 1 947; 77 KB
-
 Spectral clusterization example.png 605 × 509; 39 KB
-
Stereo-Vision-Tracking-of-Multiple-Objects-in-Complex-Indoor-Environments-sensors-10-08865-s001.ogv 2,9 s, 320 × 480; 541 KB
-
 SubspaceClustering.png 300 × 293; 27 KB
-
Super-resolution-mapping-of-glutamate-receptors-in-C.-elegans-by-confocal-correlated-PALM-srep13532-s1.ogv 2,5 s, 2 156 × 1 320; 2,87 MB
-
-
 Swedish defense Twitter mentionsgraph cluster.png 1 754 × 1 239; 1,19 MB
-
 Swiss cmeans.svg 630 × 630; 109 KB
-
-
-
The-ligand-binding-mechanism-to-purine-nucleoside-phosphorylase-elucidated-via-molecular-dynamics-ncomms7155-s2.ogv 1 min 9 s, 480 × 270; 21,12 MB
-
The-ligand-binding-mechanism-to-purine-nucleoside-phosphorylase-elucidated-via-molecular-dynamics-ncomms7155-s3.ogv 2 min 25 s, 480 × 270; 62,62 MB
-
The-ligand-binding-mechanism-to-purine-nucleoside-phosphorylase-elucidated-via-molecular-dynamics-ncomms7155-s4.ogv 1 min 3 s, 480 × 270; 20,26 MB
-
The-ligand-binding-mechanism-to-purine-nucleoside-phosphorylase-elucidated-via-molecular-dynamics-ncomms7155-s5.ogv 4 min 5 s, 480 × 270; 99,36 MB
-
The-Neuromagnetic-Dynamics-of-Time-Perception-pone.0042618.s001.ogv 4,8 s, 288 × 288; 35 KB
-
The-Neuromagnetic-Dynamics-of-Time-Perception-pone.0042618.s002.ogv 4,8 s, 288 × 288; 73 KB
-
 Truth table IV.PNG 958 × 638; 153 KB
-
Tumor-Invasion-Optimization-by-Mesenchymal-Amoeboid-Heterogeneity-srep10622-s2.ogv 17 s, 640 × 480; 1,56 MB
-
Tumor-Invasion-Optimization-by-Mesenchymal-Amoeboid-Heterogeneity-srep10622-s3.ogv 17 s, 640 × 480; 1,36 MB
-
Tumor-Invasion-Optimization-by-Mesenchymal-Amoeboid-Heterogeneity-srep10622-s4.ogv 17 s, 640 × 480; 1,32 MB
-
Tumor-Invasion-Optimization-by-Mesenchymal-Amoeboid-Heterogeneity-srep10622-s5.ogv 17 s, 640 × 480; 1,19 MB
-
Unfolding-Simulations-Reveal-the-Mechanism-of-Extreme-Unfolding-Cooperativity-in-the-Kinetically-pcbi.1000689.s007.ogv 2 min 49 s, 280 × 240; 30,84 MB
-
 UPGMA Dendrogram 5S data.svg 900 × 675; 25 KB
-
 UPGMA Dendrogram Hierarchical.svg 937 × 597; 25 KB
-
Visualizing-and-clustering-high-throughput-sub-cellular-localization-imaging-1471-2105-9-81-S1.ogv 48 s, 534 × 400; 3,55 MB
-
Visualizing-and-clustering-high-throughput-sub-cellular-localization-imaging-1471-2105-9-81-S2.ogv 48 s, 534 × 400; 3,55 MB
-
Visualizing-and-clustering-high-throughput-sub-cellular-localization-imaging-1471-2105-9-81-S3.ogv 41 s, 534 × 400; 3,66 MB
-
 WPGMA Dendrogram 5S data.svg 900 × 675; 24 KB
-
 Wykres 1.1.jpg 1 361 × 704; 30 KB
-
 תמונה 14.jpg 566 × 318; 81 KB
-
 תמונה 5.jpg 99 × 92; 4 KB
-
 תמונה 6.jpg 104 × 97; 4 KB
-
 תמונה 7.jpg 82 × 79; 3 KB
-
 תמונה 9.jpg 552 × 314; 52 KB


