Category:Computational neuroscience
Vai alla navigazione
Vai alla ricerca
study of brain function in terms of the information processing properties of the structures that make up the nervous system | |||||
| Carica un file multimediale | |||||
| Sottoclasse di | |||||
|---|---|---|---|---|---|
| |||||
Sottocategorie
Questa categoria contiene le 13 sottocategorie indicate di seguito, su un totale di 13.
A
C
- Coding mechanisms (22 F)
F
N
- Neural decoding (10 F)
- Neural oscillation (7 F)
R
- Rall dendrite model (3 F)
S
V
File nella categoria "Computational neuroscience"
Questa categoria contiene 75 file, indicati di seguito, su un totale di 75.
-
 2012 winners.jpg 1 536 × 1 024; 791 KB
-
-
-
-
 BCIAward2013.jpg 4 272 × 2 848; 3,61 MB
-
 BCIAward2015.jpg 604 × 339; 80 KB
-
 CapacitanciaNeurona.png 603 × 730; 175 KB
-

-
 Clusteron.png 2 045 × 810; 39 KB
-
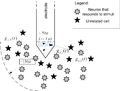
 Dynamical model of Rokni-Sompolinsky.png 881 × 1 025; 115 KB
-
En-Computational neuroscience.ogg 13 min 43 s; 6,73 MB
-
 Exponential Integrate-and-Fire (schematic).jpg 2 667 × 1 500; 109 KB
-
 Figure8 100dpi.png 354 × 374; 6 KB
-
 Firing rate improved.png 561 × 420; 7 KB
-
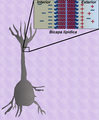
 From clusteron to sigmoidal neuron.png 746 × 1 063; 61 KB
-
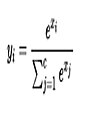 Funcion sotfmax.jpg 2 448 × 3 264; 229 KB
-

-
Functional-Brain-Networks-Develop-from-a-“Local-to-Distributed”-Organization-pcbi.1000381.s009.ogv 49 s, 1 024 × 768; 18,46 MB
-
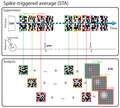 Illustration diagram for the Spike-triggered average.pdf 1 702 × 1 527; 1,21 MB
-
-
-
-
 Initial bursting AdEx model.png 3 085 × 1 100; 175 KB
-
 Integrate-and-Fire-Neuron-Model schematic drawing.jpg 2 667 × 1 500; 168 KB
-
 Isopotential contours for a spherical soma with 7 cylindrical dendrites.png 1 448 × 1 387; 342 KB
-
 Jorge V. José.jpg 1 500 × 2 100; 1,63 MB
-
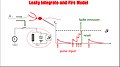 Leaky Integrate-and-Fire model neuron (schematic).jpg 2 667 × 1 500; 168 KB
-
 Modulocode.png 1 108 × 704; 63 KB
-
 MorrisLecarHomoclincTimeDomain.gif 360 × 219; 475 KB
-
 MorrisLecarHopfTimeDomain.gif 360 × 219; 597 KB
-
 MorrisLecarSNICTimeDomain.gif 360 × 219; 472 KB
-
 Multi unit measurement.png 1 563 × 1 179; 116 KB
-
Natural scenes through the koniocellular "Blue-on" retinal pathway.ogg 1 min 5 s, 504 × 288; 13,94 MB
-
Natural scenes through the magnocellular "OFF" retinal pathway.ogg 1 min 5 s, 504 × 288; 19,54 MB
-
Natural scenes through the magnocellular "ON" retinal pathway.ogg 1 min 5 s, 504 × 288; 18,53 MB
-
Natural scenes through the parvocellular "Green-on" retinal pathway.ogg 1 min 5 s, 504 × 288; 16,27 MB
-
Natural scenes through the parvocellular "Red-on" retinal pathway.ogg 1 min 5 s, 504 × 288; 17,59 MB
-
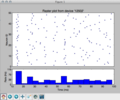 NEST raster.png 641 × 536; 38 KB
-
-

-

-
-
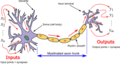 Neuron3.png 415 × 220; 46 KB
-
-
-
-
-
-
-
 OpenfMRI journal statistics, 2016-09-19.png 1 165 × 959; 103 KB
-
 Phase space trajectory of FitzHugh-Nagumo model.svg 489 × 325; 52 KB
-
-
 Representation of Prediction Error.png 1 128 × 493; 67 KB
-
 ResistenciaCapacitanciaNeurona.png 569 × 556; 23 KB
-
-
-
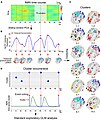 Schematic illustration of the analysis framework.jpg 1 013 × 1 199; 720 KB
-
 Schoolkids show their scientific project.jpg 3 024 × 4 032; 3,95 MB
-
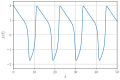
 Simulation of variable x(n) in Rulkov map.svg 713 × 461; 42 KB
-
 Simulation of variable x(t) in Fitzhugh-Nagumo model.svg 485 × 323; 22 KB
-
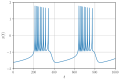 Simulation of variable x(t) in Hindmarh-Rose model.svg 492 × 329; 27 KB
-
 Spike Response Model (schematic).jpg 2 667 × 1 500; 115 KB
-
 Spike Response Model with escape noise (noisy output).jpg 2 667 × 1 500; 194 KB
-
 Spike Time Prediction with Generalized Integrate-and-Fire model.jpg 2 667 × 1 500; 187 KB
-
 Stdp biological.svg 450 × 450; 24 KB
-
 Stochastic Spike Response Model, SRM and GLM.jpg 2 667 × 1 500; 235 KB
-
Taeniopygia guttata song - pone.0025506.s001.oga 1,4 s; 12 KB
-
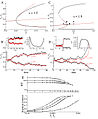
 Testing oscillatory dynamics for movement control.png 1 579 × 1 349; 76 KB
-
-
-
-
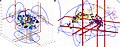 Visualizing data mining results with the Brede tools - Figure 3.jpg 1 621 × 630; 950 KB
-
 Visualizing data mining results with the Brede tools, Figure 10.png 1 041 × 385; 54 KB
-
 VOR coordinates.PNG 620 × 311; 13 KB
-
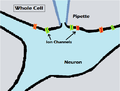 Whole Cell Patch Clamp.png 510 × 385; 12 KB


.jpg)


.jpg)


_in_Rulkov_map.svg)
_in_Fitzhugh-Nagumo_model.svg)
_in_Hindmarh-Rose_model.svg)
.jpg)
.jpg)


