Category:Data Structure Diagrams
ナビゲーションに移動
検索に移動
English: A data structure diagram (DSD) or Bachman diagram is a data model or diagram used to describe conceptual data models by providing graphical notations which document entities and their relationships, and the constraints that binds them.
visual representation of a certain kind of data model that contains entities, their relationships, and the constraints that are placed on them | |||||
| メディアをアップロード | |||||
| 上位クラス | |||||
|---|---|---|---|---|---|
| |||||
カテゴリ「Data Structure Diagrams」にあるメディア
このカテゴリに属する 70 個のファイルのうち、 70 個を表示しています。
-
 Adjacency List variation one.png 334 × 421;20キロバイト
-
 Aggregate Data Diagram.jpg 1,700 × 2,338;96キロバイト
-
 Aggregate Data Structure Diagram.jpg 850 × 1,407;196キロバイト
-
 Bachman order processing model.tiff 564 × 408;30キロバイト
-
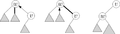
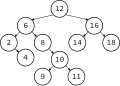 Binary Search Tree - Remove Step 1.svg 512 × 365;10キロバイト
-
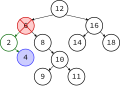 Binary Search Tree - Remove Step 2.svg 512 × 365;10キロバイト
-
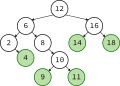
 Binary Search Tree - Remove Step 3.svg 512 × 365;9キロバイト
-
 Binary Search Tree with Leaves.svg 512 × 365;10キロバイト
-
 Binary tree array indices.svg 800 × 600;7キロバイト
-
 Data Structure Diagram.jpg 797 × 449;31キロバイト
-

-
 Diagrama.JPG 2,592 × 1,944;2.12メガバイト
-
 Dual heap.jpg 1,727 × 1,021;92キロバイト
-
 Eertree.svg 275 × 268;18キロバイト
-
 ETL jobb.jpg 908 × 358;22キロバイト
-
 Finger tree one spine.jpg 2,658 × 2,182;456キロバイト
-
 Finger tree.svg 798 × 325;9キロバイト
-
 FixedPointCombinatorGraphReduction.svg 160 × 320;2キロバイト
-
 Grafeo.JPG 552 × 260;19キロバイト
-
 Hash table 4 1 1 0 0 1 0 LL mk.svg 300 × 230;92キロバイト
-
 Hash table 4 1 1 0 0 1 0 LL-ar.svg 300 × 230;151キロバイト
-
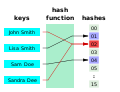 Hash table 4 1 1 0 0 1 0 LL.svg 300 × 230;11キロバイト
-
 Institutional Control Data Structure Diagram.jpg 1,046 × 1,202;185キロバイト
-
 Interval heap depq.jpg 2,699 × 1,482;184キロバイト
-
 KD tree.svg 512 × 384;44キロバイト
-
 Leaf correspondence.jpg 1,718 × 1,346;99キロバイト
-
 LinkCutAccess1.png 471 × 133;13キロバイト
-
 LinkCutAccess2.png 414 × 117;12キロバイト
-
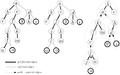 Linkcuttree1.png 560 × 349;52キロバイト
-
 Lock-free linked list error.svg 164 × 335;4キロバイト
-
 Motzkin12.svg 512 × 724;39キロバイト
-
 OBT.png 640 × 480;18キロバイト
-
 Osa metamodel v003.png 800 × 617;155キロバイト
-
 Patricia tree ASCII to binary.png 819 × 395;60キロバイト
-
 Patricia tree.png 587 × 204;24キロバイト
-
 PatriciaStructure.png 521 × 411;12キロバイト
-
 PHTreeStructure.png 915 × 202;11キロバイト
-
 Preferred paths.png 200 × 320;8キロバイト
-
 Queap.svg 415 × 224;47キロバイト
-
 Rope1.PNG 269 × 191;8キロバイト
-
 Rope2.PNG 396 × 326;17キロバイト
-
 Rope4.PNG 598 × 426;29キロバイト
-
 Rope5.PNG 595 × 436;30キロバイト
-
 Rope6.PNG 588 × 421;28キロバイト
-
 RTreeStructure.svg 512 × 384;45キロバイト
-
 RTreeStructure2.svg 512 × 384;34キロバイト
-
 Scala data structures.svg 495 × 235;136キロバイト
-
 Screen-conc.png 996 × 313;21キロバイト
-
 SequenceHeapInsert.gif 2,000 × 1,581;171キロバイト
-
 SharePointInformationStructuring.png 887 × 638;33キロバイト
-
 Simple 5 Leaf Binary Tree.svg 512 × 513;5キロバイト
-
 Sportandeventsapp2.png 1,626 × 713;22キロバイト
-
 Sportappuml.png 1,736 × 866;24キロバイト
-
 Sporte appuml.png 1,621 × 699;21キロバイト
-
 Static and dynamic data structures.svg 597 × 181;25キロバイト
-
 StructureQuadTree.png 960 × 479;22キロバイト
-
 Tor-design Tor Cells 2.png 1,519 × 435;53キロバイト
-
 Total correspondence heap.jpg 1,593 × 1,088;86キロバイト
-
 Traditional Point Data Structure Diagram.jpg 949 × 1,498;183キロバイト
-
 Tree traversal - In Order.svg 512 × 352;3キロバイト
-
 Tree traversal - Post Order.svg 512 × 255;3キロバイト
-
 Tree traversal - Pre Order.svg 512 × 292;3キロバイト
-
 Trie representation.png 1,053 × 416;77キロバイト
-
 Ufs structure.svg 1,524 × 815;19キロバイト
-
 Unix pipe.svg 886 × 390;4キロバイト
-
 Unsorted Tree.svg 512 × 256;11キロバイト
-
 UTF-8 Encoding Scheme.png 3,984 × 5,806;1.37メガバイト
-
 UUID Format.svg 567 × 270;3キロバイト
-
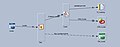
 WebCrawlerArchitecture.png 500 × 382;28キロバイト
-
 XTreeStructure.png 960 × 438;18キロバイト


