Category:Data analysis
Vai alla navigazione
Vai alla ricerca
processo di elaborazione teleologica dei dati grezzi  | |||||
| Carica un file multimediale | |||||
| Istanza di |
| ||||
|---|---|---|---|---|---|
| Sottoclasse di | |||||
| Parte di | |||||
| Argomento principale |
| ||||
| |||||
Sottocategorie
Questa categoria contiene le 10 sottocategorie indicate di seguito, su un totale di 10.
File nella categoria "Data analysis"
Questa categoria contiene 157 file, indicati di seguito, su un totale di 157.
-
 "How does HOME feel for you?" person 1.jpg 3 508 × 2 480; 268 KB
-
 "How does HOME feel for you?" person 2.jpg 3 508 × 2 480; 257 KB
-
 "How does HOME feel for you?" person 3.jpg 3 508 × 2 480; 259 KB
-
 201806 DataAnalysis on display.svg 512 × 461; 9 KB
-
 7 minosegugyi eszkoz wiki.png 928 × 676; 61 KB
-

-
 AcpClusterRL01.png 668 × 670; 35 KB
-
 AirMerIconographyCorrelation.jpg 544 × 503; 28 KB
-
 Alignment of Mycoplasma gallisepticum promoters.png 639 × 790; 75 KB
-
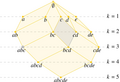
 An example of the 0-dimensional persistence barcode of a filtered complex.png 4 353 × 1 668; 310 KB
-
 Barley sampla.png 623 × 465; 14 KB
-
 Berseem egypt.png 423 × 236; 6 KB
-
 Boxplot Europe heat flow vs Moho depth.png 2 705 × 1 943; 141 KB
-
Bruls- ‘Data-analyse is het antwoord op drugsoverlast’.webm 2 min 8 s, 1 920 × 1 080; 25 MB
-
 CAH tea after ACM02.png 669 × 670; 40 KB
-
 CAH tea after ACM03.png 775 × 677; 59 KB
-
 Carrot and ECe Scurve.png 623 × 465; 18 KB
-
 Carrot and ECe tolerance.png 623 × 465; 13 KB
-
 Cars parallel coordinates.png 918 × 488; 34 KB
-
 Cli download.gif 916 × 321; 354 KB
-
 Cli download.png 719 × 240; 97 KB
-
 Cohort Analysis Chart - Gaming Example.png 476 × 971; 279 KB
-

-
 Cotton pakistan.png 623 × 465; 14 KB
-
 Data Analysis (02010671) (49836257688).jpg 5 568 × 3 712; 14,59 MB
-
 Data Analysis (02010672) (49837099907).jpg 5 301 × 3 534; 12,13 MB
-
 Data Analysis (02010673) (49836256988).jpg 5 266 × 3 511; 11,86 MB
-
 Data Analyst - The Noun Project.svg 512 × 512; 3 KB
-
 Data Fusion Information Group Model.png 509 × 324; 67 KB
-
 Data Management Architecture.png 977 × 624; 22 KB
-
 Data analysis of the Naval Reserve Force study questionnaire. (IA dataanalysisofna00caro).pdf 1 156 × 1 591, 347 pagine; 10,46 MB
-
 A data analysis system for unsteady turbulence measurements. (IA dataanalysissyst00john).pdf 1 183 × 1 579, 250 pagine; 9,81 MB
-
 Data analysis techniques for a containerized export cargo transportation system (IA dataanalysistech00mcca).pdf 1 270 × 1 625, 288 pagine; 6,5 MB
-
 Data analysis techniques for a containerized export cargo transportation system (IA dataanalysistech1665mcca).pdf 1 195 × 1 620, 288 pagine; 8,15 MB
-
 DATA ANALYTIC LITERACY FOR AIR FORCE 38F OFFICERS (IA dataanalyticlite1094564107).pdf 1 275 × 1 650, 96 pagine; 1 006 KB
-
 Dataops.gif 276 × 201; 8 KB
-
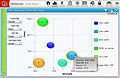 DedooseBubbleChart.jpg 400 × 260; 42 KB
-
 DedooseQualitativeExcerpting.jpg 400 × 260; 73 KB
-
 Density tet.png 569 × 423; 28 KB
-
 Design of Experiment.png 476 × 468; 67 KB
-
 Df at example.jpg 375 × 353; 18 KB
-
 Df iloc example.jpg 559 × 520; 28 KB
-
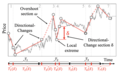 Directional-change dissection procedure.png 2 012 × 1 226; 875 KB
-
 Ensemble learning.png 800 × 600; 84 KB
-
 Example of the Multicover Bifiltration.webp 1 386 × 591; 54 KB
-
 Fig1FADM.png 605 × 511; 7 KB
-
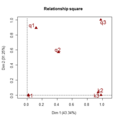 Fig2FADM.png 435 × 433; 7 KB
-
 Fig3FADM.png 436 × 432; 9 KB
-
 Fig4FADM.png 436 × 433; 7 KB
-
 Figure 5.png 800 × 600; 229 KB
-
 GAM flowchart(1).png 1 689 × 461; 16 KB
-
 Garnetriver-logo-flat-bg-notag.jpg 856 × 151; 25 KB
-
 Gedrehte Klasse.png 653 × 653; 9 KB
-
 Gedrehter Klassenraum.png 653 × 653; 9 KB
-
 Gephi pic 2.jpg 4 032 × 1 860; 2,35 MB
-
 Glm.roc.jpeg 569 × 423; 23 KB
-
 Glm.roc2.jpeg 569 × 423; 23 KB
-
 Gohana1ScrSh.png 861 × 670; 74 KB
-
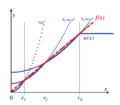
 Graphics tab sheet of SegReg.png 860 × 670; 91 KB
-
 Guttman Scale-Illustration w dichotomous items.jpg 595 × 207; 30 KB
-
 Halbach Array.jpg 5 000 × 2 813; 1,72 MB
-
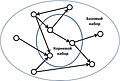
 Hubs and authorities.jpg 323 × 366; 22 KB
-
 IKANOW Logo.png 2 838 × 676; 70 KB
-
 InteractionA.Bang.png 649 × 279; 18 KB
-
 Interactions.svg 1 134 × 416; 20 KB
-
 K-means convergence to a local minimum.png 2 914 × 349; 25 KB
-
 Kriging.png 2 100 × 1 200; 169 KB
-
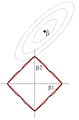
 L1 and L2 balls.svg 900 × 405; 21 KB
-
 L1-PCA.png 1 750 × 1 313; 82 KB
-
 Lambdaverror.png 1 344 × 960; 93 KB
-
 LASSO Lambda.jpeg 569 × 423; 36 KB
-
 Least squares bias 01.png 315 × 390; 7 KB
-
 LinkCorrelation3Ang.png 284 × 162; 3 KB
-
 LinkCorrelation4Ang.png 297 × 162; 4 KB
-
 LinkCorrelation5Ang.png 363 × 199; 6 KB
-
 LinkCorrelation6bisAng.png 334 × 182; 7 KB
-
 LinkCorrelation8Ang.png 494 × 214; 7 KB
-
 LinkCorrelation9Ang.png 334 × 359; 6 KB
-
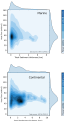
 Lithosphere thickness vs Heat Flow Marine&Continental.png 2 721 × 5 216; 696 KB
-
 Maize egypt.png 423 × 236; 6 KB
-

-
 Mustard sampla and ECe tolerance.png 623 × 465; 16 KB
-
 Mustard segm regr least squares.png 623 × 465; 18 KB
-
 Mustard segm regr no effect.png 860 × 669; 68 KB
-
 Natural time as applied in cardiology.jpg 550 × 212; 46 KB
-
 Offset (union-of-balls) filtration.png 839 × 618; 106 KB
-
 Operations.jpg 977 × 746; 100 KB
-
 OperationsEN.jpg 524 × 419; 34 KB
-
 Pandas logo.png 600 × 125; 21 KB
-
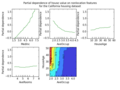 Partial depenence plots.png 800 × 600; 70 KB
-
 PCAKernel.png 2 776 × 957; 322 KB
-
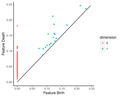 Persistence Diagram.png 1 500 × 1 200; 61 KB
-
 Piranha c300.png 703 × 415; 193 KB
-
 Plot of noisy data + Gaussian fit + plot ressduals.svg 540 × 810; 32 KB
-
 PQSQ potential.png 604 × 529; 9 KB
-
 PQSQ2.png 509 × 773; 22 KB
-
 Qubo-clustering-2.svg 390 × 200; 7 KB
-
 Random Forrest Error.png 569 × 423; 19 KB
-
 Random forrest importance.jpeg 569 × 423; 38 KB
-
 Randompath.jpg 560 × 420; 46 KB
-
 RCC 10 for the IRL transformed data Equation 19.jpg 211 × 35; 4 KB
-
 RCC 11 for the IRL transformed data Equation 20.jpg 103 × 18; 2 KB
-
 RCC 12 for the IRL transformed data Equation 21.jpg 95 × 19; 2 KB
-
 RCC 13 for the IRL transformed data Equation 22.jpg 87 × 19; 2 KB
-

-

-

-

-
 RCC 8 of the ARL transformed data Equation 16.jpg 383 × 19; 6 KB
-
 RCC 9 of the ARL transformed data Equation 17.jpg 83 × 19; 2 KB
-

-
 RCC5 for the CLR transformed data Equation 12.jpg 446 × 35; 9 KB
-

-
 Relationship of data, information and intelligence.png 960 × 720; 120 KB
-
 Response plot.png 2 100 × 1 200; 172 KB
-
 Rf2.imp.jpeg 569 × 423; 48 KB
-
 Rhomboid Tiling.webp 981 × 670; 40 KB
-
 Rice egypt (cropped).png 398 × 220; 4 KB
-
 Rice egypt.png 423 × 236; 6 KB
-
 ROC-Charakteristik eines Klassifikators.PNG 1 017 × 509; 24 KB
-
 Rp examples740.gif 740 × 252; 33 KB
-
 Sediment thickness vs Heat Flow Marine&Continental.png 2 718 × 5 111; 654 KB
-
 SegReg Anova Table.png 1 289 × 949; 233 KB
-
 SegReg Input Screen.png 860 × 669; 129 KB
-
 SegReg Residuals Graphics.png 623 × 465; 17 KB
-
 Semantic Mirror.png 1 120 × 751; 210 KB
-
 Sets.jpg 943 × 635; 94 KB
-
 SetsEN.jpg 980 × 649; 91 KB
-
 Simdec interactions.svg 1 134 × 416; 20 KB
-
 SlideQualityLife.png 1 164 × 892; 256 KB
-
 SOM versus GSOM.png 1 248 × 859; 145 KB
-
 Step-2 Live twinning.pdf 3 000 × 1 687; 327 KB
-
 SVM Example of Hyperplanes.png 371 × 218; 8 KB
-
 TabelaFundoNacionaldaCultura.jpg 467 × 331; 70 KB
-
 The Intelligence Process JP 2-0.png 960 × 720; 147 KB
-
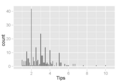
 Tips-hist1.png 849 × 570; 4 KB
-
 Tips-hist2.png 849 × 570; 4 KB
-
 Tips-scat1.png 704 × 641; 52 KB
-
 Tips-scat2.png 855 × 836; 84 KB
-
 Topological Barcode.png 1 500 × 1 200; 29 KB
-
 Training testing Ku.png 1 878 × 1 210; 42 KB
-
 Tree plot.jpeg 569 × 423; 44 KB
-
 Tulippokergraph.png 1 920 × 1 165; 1,04 MB
-
 Undergraduate statistical inference.pdf 1 239 × 1 752, 157 pagine; 34,45 MB
-
 Usersessions stackoverflow.png 647 × 779; 67 KB
-
 Usersessions wiki.png 627 × 1 482; 128 KB
-

-
 WarshipsWidthDetrendedPPPlot.png 627 × 502; 23 KB
-
 WarshipsWidthDetrendedQQPlot.png 627 × 502; 21 KB
-
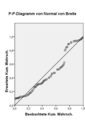 WarshipsWidthPPPlot.png 356 × 502; 19 KB
-
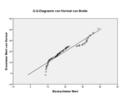 WarshipsWidthQQPlot.png 627 × 502; 22 KB
-
 Wheat egypt.png 423 × 236; 6 KB
-
 Wheat sampla and ECe tolerance.png 623 × 465; 14 KB
-
 Wheat sampla and ECe.png 623 × 465; 17 KB
-
 Wiki-Survey-Summary-of-Data-Analysis.png 4 000 × 828; 205 KB
-
 Worldcloud illustrating word usage in Chekhov's short stories.png 3 000 × 3 000; 1,74 MB
-


_(49836257688).jpg)
_(49837099907).jpg)
_(49836256988).jpg)


_filtration.png)


.png)


.png)