Category:Demographics of Japan
Aller à la navigation
Aller à la recherche
Pays d’Asie : Afghanistan · Arabie saoudite · Arménie‡ · Azerbaïdjan‡ · Bahreïn · Bangladesh · Bhoutan · Birmanie · Brunei Darussalam · Cambodge · république populaire de Chine · Chypre‡ · Corée du Nord · Corée du Sud · Égypte‡ · Émirats arabes unis · Géorgie‡ · Inde · Indonésie‡ · Irak · Iran · Israël · Japon · Jordanie · Kazakhstan‡ · Kirghizistan · Koweït · Laos · Liban · Malaisie · Maldives · Mongolie · Népal · Oman · Ouzbékistan · Pakistan · Philippines · Qatar · Russie‡ · Singapour · Sri Lanka · Syrie · Tadjikistan · Thaïlande · Timor oriental · Turquie‡ · Turkménistan · Viêt Nam · Yémen
Reconnaissance limitée : État de Palestine · Taïwan – Autres territoires : Hong Kong · Macao
‡ : situé partiellement en Asie
Reconnaissance limitée : État de Palestine · Taïwan – Autres territoires : Hong Kong · Macao
‡ : situé partiellement en Asie
日本語: 日本の人口統計 に関するカテゴリ
analyse démographique, sociologie, Japon | |||||
| Téléverser des médias | |||||
| Nature de l’élément |
| ||||
|---|---|---|---|---|---|
| Sous-classe de | |||||
| Lieu | Japon | ||||
| |||||
Sous-catégories
Cette catégorie comprend 22 sous-catégories, dont les 22 ci-dessous.
Média dans la catégorie « Demographics of Japan »
Cette catégorie comprend 48 fichiers, dont les 48 ci-dessous.
-
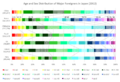 Age and Sex Distribution of Major Foreigners in Japan en.png 1 174 × 805 ; 140 kio
-
 Age and Sex Distribution of Major Foreigners in Japan ja.png 1 174 × 805 ; 140 kio
-
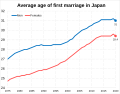 Average age of first marriage in Japan.svg 2 266 × 1 769 ; 12 kio
-
 Bdrates of Japan since 1950 de.svg 512 × 320 ; 25 kio
-
 Bdrates of Japan since 1950.svg 512 × 320 ; 25 kio
-
 Birth and death rate of japan 1950-2019.png 1 151 × 645 ; 39 kio
-
 BirthDeath 1950 JP.svg 480 × 320 ; 8 kio
-
 Crude birth and death rate of Japan (1946-2019).png 2 845 × 1 402 ; 99 kio
-
 Dates of immigration or birth of Korean residents in Japan in 1958 en.png 978 × 577 ; 159 kio
-
 Dates of immigration or birth of Korean residents in Japan in 1958.png 790 × 580 ; 159 kio
-
 Demografia Giappone (ita).png 1 097 × 599 ; 66 kio
-
 Demographics of Japan.fa.jpg 521 × 329 ; 42 kio
-
 Demography of the Sendai Domain.jpg 2 339 × 1 652 ; 236 kio
-
 Demography of the Sendai Domain.tif 2 339 × 1 652 ; 310 kio
-
 Divorce rates per 1000 of total population in Japan.svg 2 271 × 1 658 ; 7 kio
-
 Foreign residents in Japan.svg 1 080 × 540 ; 249 kio
-
 Historical population of Japan.svg 850 × 600 ; 48 kio
-
 Irene B. Taeuber Population of Japan 1958 title.jpg 1 727 × 2 360 ; 511 kio
-
 Japan Abortion Rate.svg 750 × 560 ; 12 kio
-
 Japan's Aging Population .gif 475 × 302 ; 10 kio
-
 Japanese demographics editted.png 1 097 × 599 ; 77 kio
-
 Live births and deaths of Japan (1946-2019).png 2 845 × 1 402 ; 205 kio
-
 Marriage rate per 1000 people in Japan.svg 2 365 × 1 661 ; 15 kio
-
 Marriages in Japan over time.svg 2 365 × 1 661 ; 16 kio
-
 Number of Births and Birthrate, Japan.svg 640 × 480 ; 8 kio
-
 Number of Births and Deaths, Japan.svg 640 × 480 ; 8 kio
-
 Number of births by age groups in Japan.svg 2 818 × 2 032 ; 17 kio
-
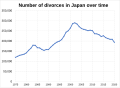 Number of divorces in Japan over time.svg 2 272 × 1 658 ; 15 kio
-
 Percentage of households which are one person households in Tokyo.svg 2 301 × 1 674 ; 15 kio
-
 Percentage of Japan who had No nationality stated in 2020.svg 512 × 569 ; 84 kio
-
 Percentage of Japan who is of Foreign nationality in 2020.svg 512 × 569 ; 84 kio
-
 Percentage of Japan who is of Japanese nationality.svg 512 × 569 ; 84 kio
-
 Population Trends in Japan, by Age.svg 900 × 450 ; 119 kio
-
 RNI 1950 JP.svg 480 × 304 ; 7 kio
-
 Tasas de nacimientos y muertes en Japón.png 510 × 560 ; 40 kio
-
 Total fertility rate of Japan overtime to 2016.svg 850 × 600 ; 45 kio
-
 出産時の母親の年齢階級別割合の推移.jpg 811 × 468 ; 73 kio
-
 在日外国人(2023年).png 3 230 × 1 701 ; 974 kio
-
 就職氷河期.jpg 503 × 424 ; 117 kio
-
 就職氷河期世代の誕生年度.png 516 × 573 ; 17 kio
-
 平成24年10月1日人口と昭和60年基準人口モデル.png 657 × 402 ; 14 kio
-
 日本の出生数と出生率1900-2010.jpg 1 398 × 909 ; 216 kio
-
 日本の出生数と合計特殊出生率1947-2018.jpg 1 256 × 821 ; 156 kio
-
 日本の出生数と合計特殊出生率(1947年~2019年).png 1 527 × 997 ; 60 kio
-
 昭和60年人口モデル.png 656 × 400 ; 11 kio
-
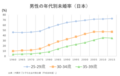 男性の年代別未婚率の推移(日本).png 1 291 × 820 ; 79 kio
-
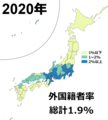 都道府県別の外国籍者率(2020年).png 975 × 1 083 ; 150 kio
-
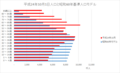
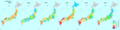 都道府県別合計特殊出生率.png 5 654 × 1 400 ; 826 kio


.png)


.png)


.png)


