Category:Demographics of the United States
Sari la navigare
Sari la căutare
Țările din America: Antigua și Barbuda · Argentina · Bahamas · Barbados · Belize · Bolivia · Brazilia · Canada · Chile · Columbia · Costa Rica · Cuba · Dominica · Ecuador · El Salvador · Guatemala · Guyana · Haiti · Honduras · Jamaica · Mexic · Nicaragua · Panama · Paraguay · Peru · Sfântul Vincențiu și Grenadine · Statele Unite ale Americii · Surinam · Trinidad și Tobago · Uruguay · Venezuela
Alte teritorii: Anguilla · Aruba · Groenlanda · Guadelupa · Guyana Franceză · Insulele Bermude · Insulele Turks și Caicos · Insulele Virgine Britanice · Martinica · Montserrat · Puerto Rico · Sint Maarten
Alte teritorii: Anguilla · Aruba · Groenlanda · Guadelupa · Guyana Franceză · Insulele Bermude · Insulele Turks și Caicos · Insulele Virgine Britanice · Martinica · Montserrat · Puerto Rico · Sint Maarten
Țările din America de Nord: Antigua și Barbuda · Bahamas · Barbados · Belize · Canada · Costa Rica · Cuba · Dominica · El Salvador · Guatemala · Haiti · Honduras · Jamaica · Mexic · Nicaragua · Panama · Sfântul Vincențiu și Grenadine · Statele Unite ale Americii‡ · Trinidad și Tobago‡
Alte teritorii: Anguilla · Groenlanda · Guadelupa · Insulele Bermude · Insulele Turks și Caicos · Insulele Virgine Britanice · Martinica · Montserrat · Puerto Rico
‡: parțial situată în America de Nord
Alte teritorii: Anguilla · Groenlanda · Guadelupa · Insulele Bermude · Insulele Turks și Caicos · Insulele Virgine Britanice · Martinica · Montserrat · Puerto Rico
‡: parțial situată în America de Nord
study of the population of the United States and how it changes | |||||
| Încarcă multimedia | |||||
| Este un/o |
| ||||
|---|---|---|---|---|---|
| Subclasă a | |||||
| Locul actual | SUA | ||||
| |||||

Subcategorii
Această categorie conține următoarele 19 subcategorii, dintr-un total de 19.
Fișiere media din categoria „Demographics of the United States”
Următoarele 92 fișiere se află în această categorie, dintr-un total de 92.
-
 American Indian and Alaskan Native population pyramid in 2020.svg 2.623x2.103; 34 KB
-
 Asian Americans population pyramid in 2020.svg 2.623x2.103; 33 KB
-
 Birthratechart.gif 964x512; 12 KB
-
 Black Americans population pyramid in 2020.svg 2.623x2.103; 33 KB
-
 Bxmuralmh.JPG 250x178; 59 KB
-
 Center of population 2162923483 f183ac07bc o.jpg 3.849x2.796; 5,74 MB
-
 Center of population LCCN2014689694.jpg 5.735x4.184; 3,36 MB
-
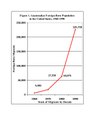
 A century of population growth from the first census of the United States to the twelfth (IA centuryofpopulat00unit).pdf 1.254 × 1.683, 344 de pagini; 25 MB
-
 Circular- "Americans! Wake Up!", September 1920.jpg 3.279x5.137; 7,42 MB
-
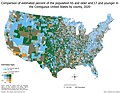 Comparison of ages in the Contiguous United States by county, 2020.jpg 5.500x4.250; 2,18 MB
-

-
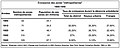 Croissance des zones "métropolitaines" 1900-1940.jpg 1.392x565; 350 KB
-
 Deaths by age group fixed.png 1.296x767; 33 KB
-
 Demographics of Youth in America.png 902x602; 160 KB
-
 Distribution of US and CA households by income relative to CE poverty lines.png 1.288x1.005; 108 KB
-
 DREAM Act.jpg 180x221; 60 KB
-
-

-
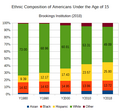 Ethnic Composition of Americans Under 15.png 497x460; 18 KB
-
 Ethnic Composition of US Cohorts.png 1.375x560; 37 KB
-
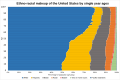 Ethno-racial makeup of the United States by single year ages in 2020.svg 3.467x2.309; 58 KB
-
 Fertility rate of the United States from 1820 to 2016.svg 850x600; 43 KB
-
 Foreign Born in U.S. Number and Share 1900-2019.png 1.383x787; 59 KB
-
 Foreign born population percentage in the US.svg 2.129x1.589; 16 KB
-
 Graph us population 1790 2010.gif 700x479; 15 KB
-
 Guatemalan Foreign Born Migration Trends.pdf 1.275x1.650; 290 KB
-
 Hispanic Americans population pyramid in 2020.svg 2.623x2.103; 33 KB
-
 Hispanic population pyramid 2021.svg 2.582x2.107; 13 KB
-
 Hispanic Whites population pyramid in 2020.svg 2.623x2.103; 33 KB
-
 Immigration to the United States over time by region.svg 3.344x1.941; 39 KB
-
 Immigration to the United States over time.svg 3.379x1.965; 21 KB
-

-
 InStateTuiton.jpg 613x288; 64 KB
-
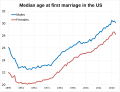 Median age at first marriage in the US.svg 2.382x1.815; 10 KB
-
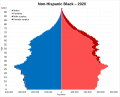 Non-Hispanic Black Americans population pyramid in 2020.svg 2.623x2.103; 34 KB
-
 Non-Hispanic White Americans population pyramid in 2020.svg 2.623x2.103; 34 KB
-
 Non-Hispanic White population pyramid 2021.svg 2.582x2.107; 14 KB
-
 Non-Hispanic White population pyramid from 1990 to 2020.gif 1.200x962; 196 KB
-
 Non-Whites in the US population pyramid in 2020.svg 2.624x2.104; 34 KB
-
 One person households in the US over time.svg 2.343x1.801; 8 KB
-

-
-

-
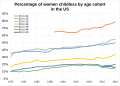 Percentage of women childless by age cohort in the US.svg 2.492x1.769; 15 KB
-
 Population pyramid of the United States by race-ethnicity in 2020.svg 3.543x2.718; 100 KB
-
 Povertythresholds-census2003.jpg 748x356; 61 KB
-
 Proj8.svg 792x612; 216 KB
-

-
 Projected US Population by Immigration Scenario 2016 to 2060.jpg 1.162x1.904; 1,06 MB
-
 Projecting Majority-Minority in the United States.jpg 1.329x1.093; 442 KB
-
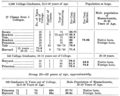 PSM V63 D177 PSM Marriage rate of college graduates.png 1.732x1.382; 367 KB
-

-
 PSM V63 D183 Decrease in the size of the american family.png 1.732x1.865; 430 KB
-
 PSM V63 D187 Reproduction of class and race.png 1.725x914; 221 KB
-
 PSM V78 D419 Us population increase between 1650 to 1900.png 1.691x1.418; 394 KB
-
 PSM V78 D420 Total population percentage of us cities of 8000 and over.png 1.673x1.151; 242 KB
-
Pt-Problemas sociais dos Estados Unidos.ogg 9 min 9 s; 5,69 MB
-
-
 Racial Ethnic Composition Children United States 2016 2060 Projections.jpg 1.373x1.435; 400 KB
-
 Racial Ethnic Composition of the United States 1970 2050 (cropped).png 2.100x1.389; 103 KB
-
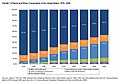 Racial Ethnic Composition of the United States 1970 2050.jpg 2.048x1.413; 663 KB
-
 Salario medio annuo in dollari.png 868x568; 64 KB
-
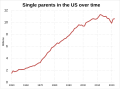 Single parents in the US over time from 1950 to 2020.svg 2.302x1.691; 7 KB
-

-
 Two or more races population pyramid in 2020.svg 2.623x2.103; 33 KB
-
 U.S. Labor Force and Employment to Population Ratios.png 1.168x470; 70 KB
-

-

-
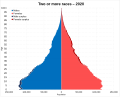
 United States population pyramid overtime from 1950 to 2020.gif 1.200x896; 437 KB
-
 US births demographic cohorts.png 712x351; 18 KB
-
 US Census Two or More Races.png 1.814x1.020; 134 KB
-
 US living adult generations.png 708x358; 15 KB
-

-

-

-
 US percent of births by age of mother and marital status.svg 750x560; 18 KB
-
 US population pyramid by race in 1970.svg 2.929x2.291; 46 KB
-
 US Race by Hispanic origin age demographics from 1990 to 2020.gif 1.200x783; 341 KB
-
 US Race by Hispanic origin demographics from 1940 to 2020.gif 1.200x1.097; 584 KB
-
 US state historical population FRED SMIL.svg 512x481; 234 KB
-
 US-center-pop.jpg 673x856; 459 KB
-
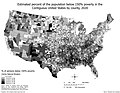
 USA Contiguous NoHighschool 2020 Hotspot.jpg 5.500x4.250; 1,93 MB
-
 USA Contiguous Population Over 65 2020.jpg 3.300x2.550; 912 KB
-
 USA Contiguous PopulationUnder17 2020.jpg 5.500x4.250; 1,88 MB
-
 USA Contiguous PopulationwithoutInsurance 2020.jpg 5.500x4.250; 1,94 MB
-
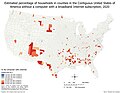 USA Contiguous PopulationwithoutInternet 2020.jpg 5.500x4.250; 1,93 MB
-
 USA Contiguous Poverty 2020.jpg 5.500x4.250; 1,83 MB
-
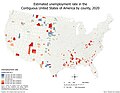 USA Contiguous Unemployment Rate 2020.jpg 5.500x4.250; 1,85 MB
-
 Uspopclock300million.png 244x83; 2 KB
-
 White America (of one race) from 1960 to 2020.gif 1.200x659; 584 KB
-
 White Americans population pyramid in 2020.svg 2.623x2.103; 33 KB
-
 Working age population - China, United States.svg 495x360; 11 KB


.jpg)


.png)


.jpg)


_from_1960_to_2020.gif)

