Category:Economics and climate change
পরিভ্রমণে চলুন
অনুসন্ধানে চলুন
English: Media related to the economics of climate change, climate finance, business management and investment related to climate change
Deutsch: Medien zu volks- und betriebswirtschaftlichen Aspekten des Klimawandels: Klimaökonomik, Investment, Klimafinanzierung, betriebswirtschaftliche Aspekte
broad economic aspects of climate change | |||||
| মিডিয়া আপলোড করুন | |||||
| যার উপশ্রেণী |
| ||||
|---|---|---|---|---|---|
| এর বিশেষ দিক | |||||
| |||||
উপবিষয়শ্রেণীসমূহ
এই বিষয়শ্রেণীতে অন্তর্ভুক্ত মোট ১৭টি উপবিষয়শ্রেণীর মধ্যে ১৭টি উপবিষয়শ্রেণী নিচে দেখানো হয়েছে।
2
A
C
- Carbon bubble (3 F)
- Carbon budget (20 F)
- Construction of solar panels (62 F)
E
F
- Fossil fuel subsidies (13 F)
G
L
V
W
"Economics and climate change" বিষয়শ্রেণীতে অন্তর্ভুক্ত মিডিয়া ফাইলগুলি
এই বিষয়শ্রেণীতে অন্তর্ভুক্ত মোট ৯১টি পাতার মধ্যে ৯১টি পাতা নিচে দেখানো হলো।
-
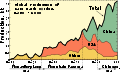
 1990- Annual greenhouse gas emissions - U.S. - line chart.svg ১,২০০ × ৬৭৫; ৫ কিলোবাইট
-
 2008- Oil and gas industry global net income - IEA.svg ১,২০০ × ৬৭৫; ৩ কিলোবাইট
-
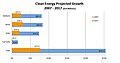
 2015- Clean energy vs fossil fuel investment - IEA.svg ১,০০০ × ৭৫০; ৩ কিলোবাইট
-
 2018- Energy transition investment versus fossil fuel investment.svg ৮৯৩ × ৭৫০; ৩ কিলোবাইট
-
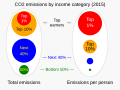
 2019 Carbon dioxide emissions by income group - Oxfam data.svg ১,২০০ × ৮৫০; ৩ কিলোবাইট
-
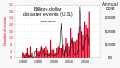 20201211 Billion dollar events related to climate change - U.S. -en.svg ১,২০০ × ৬৭৫; ৪ কিলোবাইট
-
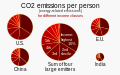
 2021 Carbon dioxide (CO2) emissions per person versus GDP per person - scatter plot.svg ১,০০০ × ৭৫০; ৯ কিলোবাইট
-
 2021 CO2 emissions by income decile - International Energy Agency IEA.svg ১,২০০ × ৭৫০; ৭ কিলোবাইট
-
 20210119 Renewable energy investment - 2004- BloombergNEF.svg ১,২০০ × ৬৭৫; ৬ কিলোবাইট
-
 20210818 Greenhouse gas emissions by income category - UN Emissions Gap Report.svg ১,০০০ × ৭৫০; ৩ কিলোবাইট
-
 2022 Counting the cost of disasters - climate change - Christian Aid.svg ১,৬০০ × ৯০০; ২ কিলোবাইট
-
 20220712 Global economic damage due to greenhouse gas emissions - by country.svg ১,২০০ × ৬৭৫; ২ কিলোবাইট
-
 20230321 Effectiveness of techniques to motivate climate mitigation action - bar chart.svg ১,২০০ × ৬৭৫; ২ কিলোবাইট
-
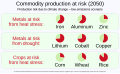 2050 Production risk of commodities due to climate change - single stressor version.svg ১,১০০ × ৬৭৫; ৪ কিলোবাইট
-
 2050 Production risk of commodities due to climate change.svg ১,২০০ × ৬৭৫; ৬ কিলোবাইট
-

-
 ArgentinaImpact.png ৩,৪০০ × ২,৪০০; ৪১৭ কিলোবাইট
-
 Carbon budget.png ৬৯৩ × ৮২৮; ২৪ কিলোবাইট
-
 Carbon Credit Flow Chart.png ১,৫১৮ × ৫৮৫; ১৭৭ কিলোবাইট
-
 Carbon intensity of GDP (using MER) for different regions, 1982-2011 (corrected).png ১,২০০ × ৬৭১; ৪৯ কিলোবাইট
-
 Carbon intensity of GDP (using PPP) for different regions, 1982-2011.png ১,২০০ × ৬৭১; ৪৯ কিলোবাইট
-
 Carbon mitigation target cost new.jpg ৮০০ × ৩৫৪; ৩৩ কিলোবাইট
-
 Carbon mitigation target cost.jpg ৯৩৩ × ৪১৩; ৪২ কিলোবাইট
-
 Carbon prices.png ১,১২১ × ৭০৫; ৭৫ কিলোবাইট
-
 Carbon-offsetting.svg ৭০০ × ৫০০; ১৫৭ কিলোবাইট
-
 Carbontrust footprint-en.svg ১০৮ × ২৩৮; ১৯ কিলোবাইট
-
 Cers-pie-Oct-2012.svg ৫৭৮ × ৫৭৮; ৭ কিলোবাইট
-

-
Civil Buildings Traffic Areas and Agriculture without any Consumption of humus rich Soil Land.ogv ৭ মি ৫০ সে, ১,২৮০ × ৭২০; ৪১.১২ মেগাবাইট
-
Civil Buildings wo Land Consumption German.ogv ৭ মি ৪১ সে, ১,২৮০ × ৭২০; ৪০.৯৮ মেগাবাইট
-
 Climate change fig5 emissions intensity.png ১,৩৩২ × ৪৯৯; ৫২ কিলোবাইট
-
 Climate change fig5 emissions per capita.png ১,৩২০ × ৪৬৬; ৩৪ কিলোবাইট
-
 Climate change fig5 total emissions.png ১,২৯৮ × ৪৬৭; ৫৯ কিলোবাইট
-
 Climate change gdp per capita.png ১,৬৫৬ × ৫৫৯; ৬২ কিলোবাইট
-
 Climate Funds.jpg ৫৯৫ × ৫১০; ৫০ কিলোবাইট
-
 CO2-emissions-by-income-and-region-768x774.png ৫,৩৫২ × ৫,৩৯৪; ৮২১ কিলোবাইট
-
 CO2-Preis Klimakabinett vs. Wissenschaft.png ৯৭৬ × ৬৩০; ৪৭ কিলোবাইট
-
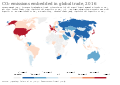 CO₂ emissions embedded in global trade, OWID.svg ৮৫০ × ৬০০; ১৪১ কিলোবাইট
-
 CO₂ emissions embedded in trade, OWID.svg ৮৫০ × ৬০০; ১৪১ কিলোবাইট
-
 Damage-costs-from-natural-disasters.png ৩,৪০০ × ২,৪০০; ৩৬৬ কিলোবাইট
-
 Deforestation-emissions-in-trade-–-Sankey-01.png ১,৪৯৩ × ১,৭১৪; ২০৭ কিলোবাইট
-
 Developed reserves and committed emissions by top emitter countries.jpg ১,৭২৫ × ১,৬৩১; ৪৭০ কিলোবাইট
-
 Distribution of committed CO2 emissions from developed fossil fuel reserves.jpg ১,৭২৫ × ২,১৭৬; ১.০৩ মেগাবাইট
-
 Econimpact2c.png ৩,৪০০ × ২,৪০০; ৪৪৮ কিলোবাইট
-
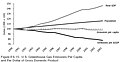
 Economics of climate change chapter3 figure2.png ১,৩০০ × ৯৩৬; ৪৪ কিলোবাইট
-
 Edenhofer Kalkuhl Ockenfels 2020 Klimaschutzprogramm Bundesregierung.jpg ২,০০৮ × ১,০৩১; ৪০০ কিলোবাইট
-
 Efficiencyreboundgraph.png ৬২৩ × ৩৪৩; ৩২ কিলোবাইট
-
 Employment in selected energy subsectors, 2019.png ১,৯২০ × ১,০৮০; ৩৮০ কিলোবাইট
-
 EricksonEtAl 2015 AssessingCarbonLockin EnvironmentalResearchLetters.jpg ১,৭২০ × ১,০৬৩; ৩৭১ কিলোবাইট
-
 Estimated distribution of economic damages due to climate-driven sea-level rise across European regions.webp ১,৫৯৪ × ১,৬৭৬; ২৩৩ কিলোবাইট
-
 Estimates of the Economic Damage of Climate Change.png ৩৩২ × ৫৭২; ১৪ কিলোবাইট
-
 ETS and carbon tax world map.svg ২,৫৬০ × ১,৩১৪; ৬.৪৭ মেগাবাইট
-
 Extreme weather in the US 1980-2011-tr.png ৮০০ × ৫৩৬; ৪৯৪ কিলোবাইট
-
 Extreme weather in the US 1980-2011.png ৮০০ × ৫৩৬; ৪৭১ কিলোবাইট
-
 Financial flows for climate change mitigation and adaptation in developing countries.jpg ৭৪৯ × ৬১১; ৫৭ কিলোবাইট
-
 Foreigninvestment.jpg ৭২০ × ৫৪০; ৯০ কিলোবাইট
-
 Fossil-fuel subsidies as a share of GDP, OWID.svg ৮৫০ × ৬০০; ১৩৯ কিলোবাইট
-
 Fossil-fuel-subsidies-gdp.svg ৮৫০ × ৬০০; ১৬৮ কিলোবাইট
-
 Fossil-fuel-subsidies-per-capita.svg ৮৫০ × ৬০০; ১৬৮ কিলোবাইট
-
 GHG intensity 2000.svg ৯৪০ × ৪৭৭; ১.৯৮ মেগাবাইট
-
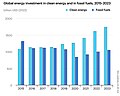 Global energy investment in clean energy and in fossil fuels, 2015-2023.jpg ৬৫২ × ৫২১; ৯২ কিলোবাইট
-

-
 Global weather disaster losses as a share of GDP, OWID.svg ৮৫০ × ৬০০; ৮ কিলোবাইট
-

-
 How rationing was utilised during WWII to distribute scarce goods.jpg ১,২০০ × ৬৬৯; ৯৩ কিলোবাইট
-
 InternalPriceOnCarbon.png ৫৮০ × ৬৭০; ৭৫ কিলোবাইট
-
 Investment in renewable energy, by technology, OWID.svg ৮৫০ × ৬০০; ১৮ কিলোবাইট
-
 JevonsParadoxA.png ৬৫২ × ৩৬২; ১২ কিলোবাইট
-
 JevonsParadoxB.png ৬৫২ × ৩৬২; ১৩ কিলোবাইট
-
 Klimafinanzierung 2014-2020.png ১,১৮৮ × ৭৬৭; ৩৯ কিলোবাইট
-
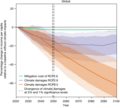 Kotz 2024 global impact divergence.png ১,০২৯ × ৯২৫; ৯৬ কিলোবাইট
-
 Landscape2015 MainSankey.png ৩,৫০৮ × ২,৪৮০; ৫৬৩ কিলোবাইট
-
 Location of coal miners globally.png ১,৯২০ × ১,০৮০; ৪৯৭ কিলোবাইট
-
 Long-term economic and sustainable recovery spending, as of end March 2022.jpg ১,৯২০ × ১,০৮০; ৮৪ কিলোবাইট
-
 Price-of-electricity-new-renewables-vs-new-fossil-no-geo.png ২,৪২৬ × ৩,৭৪৭; ৩৬২ কিলোবাইট
-
 Rareearth production.svg ৪৪২ × ২৬৮; ১৮ কিলোবাইট
-
 Ratio of GDP to carbon dioxide emissions.PNG ১,৩৪৭ × ৬২৮; ৩১ কিলোবাইট
-
 Re investment 1995-2007.jpg ৬৫৭ × ৩৮৩; ৮৭ কিলোবাইট
-
 Re investment 2007-2017.jpg ৭৭৩ × ৪০৩; ১১৫ কিলোবাইট
-
 Renewable energy increases employment in Turkey.jpg ২,৮০০ × ২,৪৯৯; ৭৪৮ কিলোবাইট
-
 Renewable-energy-investment.png ৩,৪০০ × ২,৪০০; ৬৬০ কিলোবাইট
-

-
 Salzburg - Lehen - Schuhmacherstraße Motiv - 2020 06 03-2.jpg ৪,৬১৩ × ৩,০৭৫; ৩.২৭ মেগাবাইট
-
 SaveGER6-Demonstration des Nuklearia e. V.jpg ২,০০০ × ১,৫০০; ৫৪২ কিলোবাইট
-
 Scope3 Calculation Guidance -updated.png ১,৫৭৫ × ১,০০০; ৫৪৩ কিলোবাইট
-
 Totalrealgdp.jpg ৭২০ × ৫৪০; ৮৭ কিলোবাইট
-
 Towards Sustainable Transport Systems.png ৩,৭১৮ × ৪,১৫৯; ৩৬১ কিলোবাইট
-
 UK car vehicle excise duty 2013.svg ৫১২ × ১,৫৩৬; ৬ কিলোবাইট
-
 US GG Emissions per Cap and per Dollar GDP.jpg ৬৭২ × ৩৪৯; ৬১ কিলোবাইট
-
Was kostet der Klimawandel?.webm ১ মি ২৮ সে, ১,৯২০ × ১,০৮০; ১৫৬.৫৫ মেগাবাইট
-
 Water St Moore St td (2018-08-09) 02.jpg ৫,৪৭২ × ৩,৬৪৮; ৫.২৮ মেগাবাইট


_emissions_per_person_versus_GDP_per_person_-_scatter_plot.svg)


_for_different_regions,_1982-2011_(corrected).png)
_for_different_regions,_1982-2011.png)


.jpg)


_02.jpg)