Category:Economy of Taiwan
Zur Navigation springen
Zur Suche springen
economy of the country | |||||
| Medium hochladen | |||||
| Ist ein(e) | |||||
|---|---|---|---|---|---|
| Unterklasse von | |||||
| Währung |
| ||||
| Bruttoinlandsprodukt |
| ||||
| Wachstumsrate |
| ||||
| Inflationsrate |
| ||||
| Umsatzsteuersatz |
| ||||
| Ort | Republik China | ||||
| offizielle Website | |||||
| |||||
Unterkategorien
Es werden 31 von insgesamt 31 Unterkategorien in dieser Kategorie angezeigt:
In Klammern die Anzahl der enthaltenen Kategorien (K), Seiten (S), Dateien (D)
!
+
B
C
E
F
H
I
- Invoices from Taiwan (1 D)
M
N
P
Q
- Quintuple Stimulus Vouchers (26 D)
R
- ROC consumer voucher (4 D)
S
T
- Triple Stimulus Vouchers (10 D)
W
Medien in der Kategorie „Economy of Taiwan“
Folgende 16 Dateien sind in dieser Kategorie, von 16 insgesamt.
-
 AUO Taichung factory building.jpg 2.945 × 2.208; 773 KB
-
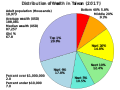 Distribution of Wealth in Taiwan.svg 800 × 600; 24 KB
-
 Energieerzeugung in Taiwan seit 2001.svg 655 × 438; 19 KB
-
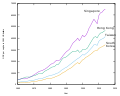 Four Tigers GDP per capita.svg 600 × 480; 15 KB
-
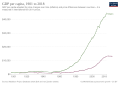 GDP per capita development in China and Taiwan.svg 850 × 600; 43 KB
-
 GDP per capita development in Taiwan.svg 850 × 600; 35 KB
-
 GDP per capita in East Asia, 1870-1950.svg 953 × 669; 90 KB
-
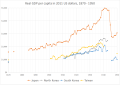
 GDP per capita in East Asia, 1870-2018.svg 953 × 669; 99 KB
-
 GDP per capita in East Asia, 1945-2018.svg 953 × 669; 102 KB
-
 Japan - Korea PLATTS Natural Gas Price.webp 4.416 × 1.005; 74 KB
-
 Tables of business data on United Daily newspaper.jpg 6.956 × 5.055; 13,48 MB
-
 Taiwan bonds.webp 5.326 × 1.877; 346 KB
-
 Taiwan Dollar to Chinese Yuan exchange rate.webp 1.613 × 420; 22 KB
-
 Taiwanische Häfen - Umschlag 2001-2014.svg 931 × 522; 23 KB
-
 Tigerstaaten pro-Kopf-BIP 1960-2014.svg 600 × 480; 9 KB
-
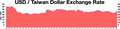 USD to Taiwan Dollar exchange rate.webp 1.560 × 382; 25 KB


