Category:Hypothesis testing
ナビゲーションに移動
検索に移動
method of statistical inference | |||||
| メディアをアップロード | |||||
| 話し言葉の音声 | |||||
|---|---|---|---|---|---|
| 分類 |
| ||||
| 上位クラス | |||||
| 親項目 | |||||
| 以下と異なる | |||||
| 同一とされる事物 | 統計調査 | ||||
| |||||
下位カテゴリ
このカテゴリに属する 8 個のサブカテゴリのうち、 8 個を表示しています。
B
- Binomial test (9ファイル)
C
- Chow test (11ファイル)
F
- False discovery rate (5ファイル)
K
- Kolmogorov-Smirnov test (6ファイル)
P
- Predictive value of tests (33ファイル)
R
- Receiver operating characteristic (38ファイル)
S
- Significance tests (5ファイル)
カテゴリ「Hypothesis testing」にあるメディア
このカテゴリに属する 52 個のファイルのうち、 52 個を表示しています。
-
 1 rvA8kEjThT6rr0Drydjxcg.webp 1,024 × 598;35キロバイト
-
 1 XJcHqX30AEOTHLPx-E 5Xw.webp 974 × 460;15キロバイト
-
 Alarm dilemma.png 385 × 227;14キロバイト
-
 Area-de-aceptacion-y-rechazo-chicuadrado-ejemplo.png 423 × 173;12キロバイト
-
 Area-de-aceptacion-y-rechazo-mayor-ejemplo.png 423 × 173;12キロバイト
-
 Area-de-aceptacion-y-rechazo-mayor.png 423 × 173;15キロバイト
-
 Area-de-aceptacion-y-rechazo-menor.png 423 × 173;15キロバイト
-
 Benjamini-Hochberg-correction.png 521 × 347;18キロバイト
-
 Beta-Fehler.png 730 × 768;38キロバイト
-
 Betafehler.pdf 2,081 × 1,039;35キロバイト
-
 Chi i anden test.jpg 424 × 299;10キロバイト
-
 Chi squared test 0001.svg 1,400 × 800;9キロバイト
-
 Choix des risques de premiere et deuxieme espece.png 786 × 381;14キロバイト
-
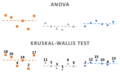 Difference between ANOVA and KW test.png 861 × 521;14キロバイト
-
Elementary Statistics Video Lecture Hypothesis Testing with a Single Mean.ogv 28分 58秒、 320 × 240;83.36メガバイト
-
Elementary Statistics Video Lecture Hypothesis Testing with Two Means.ogv 28分 50秒、 320 × 240;83.25メガバイト
-
 Evidence And Theory 01.svg 1,052 × 744;78キロバイト
-
 Evidence And Theory 02.svg 1,200 × 8,000;94キロバイト
-
 F-test plot.svg 540 × 360;24キロバイト
-
 Fabricadegraos.svg 454 × 227;26キロバイト
-
 H0 h1 fehler.jpg 941 × 502;64キロバイト
-
 Hypothesis Testing.webp 1,100 × 730;38キロバイト
-
 Illustration.pdf 900 × 750;52キロバイト
-
 Klayman Ha1 vi.svg 512 × 362;1キロバイト
-
 Klayman Ha2 vi.svg 512 × 363;1キロバイト
-
 Klayman Ha3 vi.svg 512 × 362;1キロバイト
-
 Moedahonesta.svg 454 × 227;24キロバイト
-
 Neyman-Pearson.svg 344 × 261;143キロバイト
-
 Neyman-Pearson2.svg 344 × 261;143キロバイト
-
 NormalDist1.96.png 499 × 333;10キロバイト
-
 NPGQPlota.svg 630 × 630;92キロバイト
-
 Null hypothesis testing.png 3,708 × 1,202;247キロバイト
-
 Origins Of Hybrid Hypothesis Testing.png 500 × 1,467;336キロバイト
-
 P value vs alpha error.svg 311 × 262;30キロバイト
-
 P value.png 1,179 × 840;104キロバイト
-
 P-valor.gif 616 × 330;299キロバイト
-
 P-value vs SN.gif 576 × 229;1.35メガバイト
-
 P-Wert.gif 616 × 330;207キロバイト
-
 PowerFunctionAndSampleSize-one-sided de.png 720 × 600;6キロバイト
-
 Prep.png 560 × 420;4キロバイト
-
 ROC curves colors.svg 602 × 567;32キロバイト
-
 ROC curves.svg 651 × 593;29キロバイト
-
 Rozkład wartości p dla H0 i H1 przy wysokiej mocy testu.svg 512 × 512;24キロバイト
-
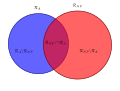
 Sobel Test Venn Diagram.png 528 × 587;22キロバイト
-
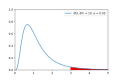
 T rejection region.svg 1,704 × 742;8キロバイト
-
 Teste-de-hipóteses.gif 623 × 325;464キロバイト
-
 TOC.png 910 × 660;30キロバイト
-
 TOC1.png 683 × 495;38キロバイト
-
 TOC2.png 683 × 495;39キロバイト
-
 TOC3.png 683 × 495;39キロバイト
-
-
 TypeTwoErrorAsFunctionOfMu de.png 950 × 1,344;19キロバイト


