Category:Income
Pereiti į navigaciją
Jump to search
consumption and savings opportunity gained by an entity within a specified timeframe | |||||
| Įkelti mediją | |||||
| Poklasis |
| ||||
|---|---|---|---|---|---|
| Teminiu požiūriu nurodo | |||||
| Skiriasi nuo | |||||
| Tas pats kaip | income | ||||
| |||||
Subkategorijos
Rodoma 12 subkategorijų (iš viso yra 12 subkategorijų).
B
D
G
H
I
- Income declaration (7 F)
N
P
Q
S
U
- US Federal Taxes by Income Level 1979-2007 (1 P, 18 F)
Daugialypės terpės rinkmenos kategorijoje „Income“
Rodomi 84 šios kategorijos rinkmenos (iš viso kategorijoje yra 84 rinkmenos).
-
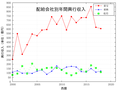
 2017- Top earners on YouTube - column chart.svg 1 200 × 675; 2 KiB
-
 African Americans and Same Sex Couples Incomes.jpg 451 × 633; 94 KiB
-
 Annual air transport consumption in the UK by income quintile, 1920–2019.jpg 1 720 × 1 112; 305 KiB
-
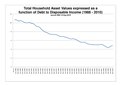 Asset Value as function of Debt to Disposable Income 1988-2010.pdf 1 752 × 1 239; 68 KiB
-
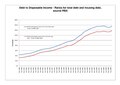 Australian Household Debt to Disposable Income - total versus housing to Dec 2009.pdf 1 752 × 1 239; 121 KiB
-
 BeBereinigte lohnquote 1960 2011 ameco.png 759 × 367; 5 KiB
-
 Binomial tree irates(es).png 513 × 329; 41 KiB
-
 BNE-NNE-VE Deutschland70-03.png 1 280 × 960; 19 KiB
-
 Break-even-point vector.svg 635 × 340; 13 KiB
-
 Break-even-point.png 654 × 359; 16 KiB
-
 Bud Fisher with Mutt & Jeff.jpg 443 × 636; 92 KiB
-
 Changes Top 1% Share and Top Marginal Tax Rate v2.jpg 915 × 794; 108 KiB
-
 Classi di reddito in Italia nel 2019.png 999 × 799; 133 KiB
-
 Classical aggregate expenditure.png 794 × 570; 16 KiB
-
 Corporate Income Tax as a Share of GDP, 1946 - 2009.png 913 × 663; 21 KiB
-
 Cournotscher Punkt 2.png 732 × 534; 31 KiB
-
 Deferred Corporate Foreign Earnings 2001-2010.jpg 1 050 × 787; 85 KiB
-
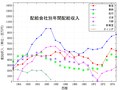
 Distributors income in Japan.png 640 × 480; 46 KiB
-
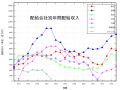
 Distributors income in Japan.svg 640 × 480; 38 KiB
-
 Domande accolte per reddito di emergenza.png 716 × 516; 67 KiB
-
 Durchschnitts- und Medianeinkommen.png 1 362 × 1 131; 35 KiB
-
 Einnahmebeleg.jpg 1 498 × 1 221; 1,07 MiB
-
 Entscheidung über die Erwerbsbeteiligung.jpg 558 × 417; 8 KiB
-
 Evolution des inégalités de revenu dans le monde de 1820 à 2020.png 1 037 × 637; 104 KiB
-
 Example of Income Deficit.jpg 1 215 × 717; 79 KiB
-
 Family income boxplot.png 511 × 318; 11 KiB
-
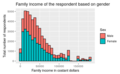 Family income.png 510 × 315; 22 KiB
-
 Figura 2grup11.png 221 × 215; 3 KiB
-
 Gewinnschwelle 1.1.svg 635 × 340; 65 KiB
-
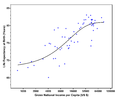 GNI and Life Expectancy log scale.png 4 265 × 3 536; 208 KiB
-
 Growth of Real Disposable Household Income by Decile, OWID.svg 850 × 600; 13 KiB
-
 Historic Airline Pilot Pay 1999 to 2011.JPG 960 × 720; 64 KiB
-
 Historic Commercial Pilot Pay 1999 to 2011.JPG 960 × 720; 58 KiB
-
 Images istochniki doxoda.jpg 1 366 × 666; 185 KiB
-
 Importi medi mensili di Reddito di Cittadinanza.png 767 × 562; 64 KiB
-
 Income and Expenditures by Age Group.png 960 × 564; 119 KiB
-
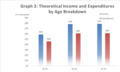 Income and Theoretical Expenditures by Age Group.png 987 × 589; 108 KiB
-
 Income by profession.jpg 808 × 493; 31 KiB
-
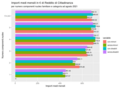
 Individual Disposable Income (excl. NI).png 1 315 × 1 218; 556 KiB
-
 Ingreso y el ciclo de vida.png 1 160 × 700; 312 KiB
-
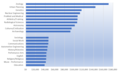
 Innovation performance per income levels 2021.png 628 × 804; 127 KiB
-
 Inégalités de revenu dans le monde en 2021.png 1 030 × 555; 63 KiB
-
 Keynesian aggregate expenditure.png 794 × 570; 19 KiB
-
 Keynesian cross and growth in expenditure.png 874 × 569; 28 KiB
-
 Lakhpati Kisan - Prototypes and their Layering.png 602 × 401; 78 KiB
-
 LGIM0081 (7105311831).jpg 1 200 × 1 600; 435 KiB
-
 Life expectancy in macroregion -income comparison -ru.png 1 386 × 880; 101 KiB
-
 Life expectancy in macroregion -income comparison.png 1 386 × 880; 99 KiB
-
 Life expectancy in macroregion -income high -diff -ru.png 1 153 × 721; 89 KiB
-
 Life expectancy in macroregion -income high -diff.png 1 153 × 721; 83 KiB
-
 Life expectancy in macroregion -income high -ru.png 1 162 × 607; 77 KiB
-
 Life expectancy in macroregion -income high.png 1 162 × 607; 72 KiB
-
 Life expectancy in macroregion -income low -diff -ru.png 1 153 × 721; 105 KiB
-
 Life expectancy in macroregion -income low -diff.png 1 153 × 721; 99 KiB
-
 Life expectancy in macroregion -income low -ru.png 1 162 × 607; 92 KiB
-
 Life expectancy in macroregion -income low.png 1 162 × 607; 87 KiB
-
 Life expectancy in macroregion -income middle -diff -ru.png 1 153 × 721; 98 KiB
-
 Life expectancy in macroregion -income middle -diff.png 1 153 × 721; 93 KiB
-
 Life expectancy in macroregion -income middle -ru.png 1 162 × 607; 87 KiB
-
 Life expectancy in macroregion -income middle.png 1 162 × 607; 83 KiB
-
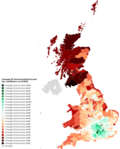
 Map DispINC PT 2016 EUSILC neu.svg 512 × 284; 55 KiB
-
 Mean income by education and gender - 2020.png 3 603 × 2 247; 270 KiB
-
 Median and mean household disposable income, OWID.svg 850 × 600; 7 KiB
-
 Median household disposable income, OWID.svg 850 × 600; 6 KiB
-

-
 Median Income and Unemployment Rate by Education United States 2015.png 1 033 × 602; 52 KiB
-
 Median Incomes US.png 425 × 331; 11 KiB
-
 Movie distributor's ticketsales in Japan.png 640 × 480; 44 KiB
-
 Movie distributor's ticketsales in Japan.svg 640 × 480; 36 KiB
-
 Nivel de ingreso - Función de ingreso de Minceer.png 462 × 452; 40 KiB
-
 Nominalni-mzda-cr.svg 1 352 × 700; 15 KiB
-
 OAS valuation tree (es).png 640 × 550; 45 KiB
-
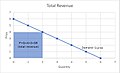 P × Q = Total Revenue.jpg 1 507 × 920; 146 KiB
-
 Per capita personal income by County.webp 3 740 × 2 407; 870 KiB
-
 Population by income level (World Bank), OWID.svg 850 × 600; 13 KiB
-
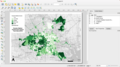 QGIS Interface Screenshot with Map of Median Income in Houston (2010).png 2 610 × 1 464; 986 KiB
-
 Quittung.png 750 × 518; 13 KiB
-
 Reddito medio.png 567 × 377; 39 KiB
-
 Rental1953 1975.png 640 × 480; 40 KiB
-
 Rental1953 1975.svg 640 × 480; 48 KiB
-
 Starting Salary By Selected College Majors United States.png 1 011 × 608; 36 KiB
-
 Stati per reddito di base o minimo garantito in euro.png 641 × 474; 91 KiB
-
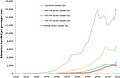
 UK Average House Price.png 1 242 × 1 147; 453 KiB
-
 UK Median Gross Household Income (excl. NI).png 1 404 × 1 063; 478 KiB


.png)


.png)


.jpg)


.png)


.png)


,_OWID.svg)
.png)


.png)