Category:Macroeconomics
Pereiti į navigaciją
Jump to search
branch of economics that studies aggregated indicators  | |||||
| Įkelti mediją | |||||
| Tai yra | |||||
|---|---|---|---|---|---|
| Poklasis | |||||
| Yra dalis | |||||
| Teminiu požiūriu nurodo | |||||
| |||||
Subkategorijos
Rodoma 17 subkategorijų (iš viso yra 17 subkategorijų).
Daugialypės terpės rinkmenos kategorijoje „Macroeconomics“
Šioje kategorijoje yra viena rinkmena.
-
 1937 to 1943 vs 2008 to 2011.png 991 × 669; 87 KiB
-
 1990-91recessionb.png 963 × 503; 18 KiB
-
 Aabenmodel.GIF 1 365 × 1 408; 37 KiB
-
 Anlagevermögen nach McKinsey.png 894 × 617; 32 KiB
-
 Annual Gross World Product Growth 1,000,000-2011 DeLong.png 1 576 × 560; 19 KiB
-
 Anpassungspfad.svg 721 × 597; 17 KiB
-
 Aussenhandel entwicklung deutschland.png 2 800 × 1 700; 67 KiB
-
 Balancecourante.jpg 1 200 × 800; 58 KiB
-
 Banco de Inglaterra, Londres, Inglaterra, 2014-08-11.jpg 440 × 275; 41 KiB
-
 BBP 1929-1939.PNG 596 × 410; 10 KiB
-
 Bemmann Optionspreismodell.PNG 1 228 × 635; 45 KiB
-
 Benefit Corporation legislation in USA.svg 959 × 593; 120 KiB
-
 Berechnungsformel der Bürokratiebelastung.JPG 934 × 365; 36 KiB
-
 Biljetten-eurozone2002-2009.jpg 484 × 292; 30 KiB
-
 BIPBRD5004.svg 800 × 550; 49 KiB
-
 BNE-NNE-VE Deutschland70-03.png 1 280 × 960; 19 KiB
-
 Borio2003.png 839 × 417; 47 KiB
-
 Branchenstruktur.jpg 874 × 460; 114 KiB
-
 Bruttoinlandsprodukt DE.svg 723 × 578; 17 KiB
-
 Builders' real day wages, 1209-2004.png 485 × 332; 13 KiB
-
 CEE 2005 impulse response functions.png 972 × 683; 71 KiB
-
 CircularFaPNG.png 674 × 743; 129 KiB
-
 CircularFlowEN-SVG.svg 646 × 711; 541 KiB
-
 CircularFlowEN.png 674 × 743; 146 KiB
-
 CircularFlowFa.svg 646 × 711; 522 KiB
-
 Circulation in macroeconomics-fr es en.svg 859 × 729; 36 KiB
-
 Circulation in macroeconomics-fr es.svg 859 × 729; 34 KiB
-
 Consumption Function.png 1 431 × 1 284; 61 KiB
-
 Consumption Function.svg 3 012 × 3 012; 23 KiB
-
 Council of Economic Advisers.png 600 × 600; 213 KiB
-
 Cournotscher Punkt 2.png 732 × 534; 31 KiB
-
 Cournotscher Punkt.svg 1 051 × 843; 15 KiB
-
 Croissance pib habitant france.png 480 × 346; 19 KiB
-
 Croissance économie francaise.png 597 × 435; 53 KiB
-
 Cumulative Current Account Balance per capita.png 1 800 × 820; 229 KiB
-
 Cumulative Current Account Balance.png 1 800 × 820; 239 KiB
-
 Current Account Balance % GDP 2006.PNG 1 425 × 625; 56 KiB
-
 Current Account Balance 2006.png 1 425 × 625; 56 KiB
-
 Current Account Balance per capita 2006.PNG 1 425 × 625; 55 KiB
-
 Dakhla,Tagelöhner1.jpg 1 280 × 818; 165 KiB
-
 Dani Rodrik ekonomilaria.jpg 750 × 768; 57 KiB
-
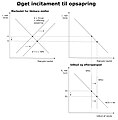
 Deflasyonist Açık.jpg 1 703 × 857; 203 KiB
-
 Deflation.gif 349 × 282; 3 KiB
-
 Devisenmarkt.png 755 × 568; 16 KiB
-
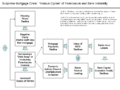
 DiagFuncMacroSyst.pdf 1 239 × 1 752; 69 KiB
-
 Dreiecksverhältnis.jpg 392 × 222; 17 KiB
-
 East African Shilling Map.png 770 × 360; 28 KiB
-
 Echanges commerciaux france.png 680 × 412; 69 KiB
-
 Economics supply shock.png 373 × 376; 12 KiB
-
 Einfacher Wirtschaftskreislauf.png 1 024 × 852; 11 KiB
-
 Emplois industrie.png 480 × 346; 17 KiB
-
EN Gold Standard.ogg 25 min 11 s; 17,43 MiB
-
 Entorno-Organizacion SI.JPG 596 × 374; 41 KiB
-
 Entscheidung über die Erwerbsbeteiligung.jpg 558 × 417; 8 KiB
-
 Entwicklung Arbeitslosenquote.svg 496 × 290; 117 KiB
-
 Entwicklung der Staatsschuldenquote in Deutschland.png 1 807 × 1 119; 98 KiB
-
 Eurostat.png 379 × 350; 19 KiB
-
 Existing Home Sales Chart - v 1.0.png 960 × 720; 23 KiB
-
 Fehlerkorrekturmodell BSP Land X Y.jpg 725 × 488; 68 KiB
-
 Flagi i choragiewki.jpg 376 × 257; 21 KiB
-
 FoodProductionIndex.png 411 × 308; 27 KiB
-
 Forbrugerprisindeks.gif 600 × 400; 35 KiB
-
 Foreclosure Trend - 2007.png 960 × 720; 10 KiB
-
 Foreclosure Trend.png 960 × 720; 24 KiB
-
 France Trade Balance.png 680 × 412; 67 KiB
-
 FrentePareto.svg 744 × 612; 12 KiB
-
 Gdp accumulated change-fr.png 1 070 × 607; 52 KiB
-
 Gdp to debt ratio.svg 1 800 × 1 440; 377 KiB
-
 Gender Gap Report 2008 cover.jpg 1 366 × 1 935; 831 KiB
-
 Gendergap2008.PNG 1 350 × 657; 55 KiB
-
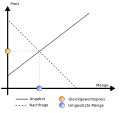 Gleichgewichtspreis.svg 460 × 430; 17 KiB
-
 The Global Economy by the NYU Stern Department of Economics.pdf 900 × 1 350, 289 puslapiai; 1,93 MiB
-
 Global Reserve Currencies.png 1 121 × 793; 502 KiB
-
 GlobalTrade wheat coarse grain soy 2008 usda.png 431 × 327; 5 KiB
-
 GNP world.svg 863 × 443; 1,63 MiB
-
 Graf prosječnih i graničnih troškova.png 1 761 × 2 381; 5,52 MiB
-
 GrafikderKaufkrafttheorieundGegenargumente.svg 512 × 280; 11 KiB
-
 Historico petroleo.jpg 450 × 400; 40 KiB
-
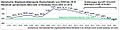 Historische Staatsschuldenquote Deutschlands von 2002 bis 2015.jpg 1 076 × 271; 127 KiB
-
 Impossible trinity es.png 367 × 237; 18 KiB
-
 Index of Economic Freedom 2008.png 1 350 × 625; 47 KiB
-
 InvestitionsquotenUSAJBRD.PNG 970 × 604; 49 KiB
-
 Invop.JPG 1 404 × 1 427; 105 KiB
-
 IPC a Catalunya.jpg 857 × 516; 50 KiB
-
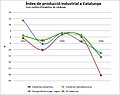 IPI Catalunya.jpg 654 × 516; 42 KiB
-
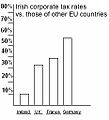 Ireland tax comparision.jpg 232 × 255; 24 KiB
-
 IWI(francais).png 1 526 × 998; 91 KiB
-
 J curve.svg 316 × 200; 9 KiB
-
 J-Kurve2.png 494 × 262; 6 KiB
-
 Jadrova inflacia.jpg 650 × 426; 236 KiB
-
 Japan Stock Price.gif 497 × 428; 25 KiB
-
 Julesdupuit.jpg 115 × 162; 13 KiB
-
 Kapitalflugt.GIF 1 399 × 1 408; 32 KiB
-
 Keynesian cross and growth in expenditure.png 874 × 569; 28 KiB
-
 Keynesianisches-Totalmodell.png 794 × 1 123; 48 KiB
-
 Knowledge capital and economic growth rates in different regions.png 960 × 960; 71 KiB
-
 Knowledge capital and economic growth rates in different regions.svg 630 × 630; 27 KiB
-
 Ks carte print 120510 UPDATED.jpg 1 500 × 1 071; 583 KiB
-
 Kurs stopa parytet.svg 325 × 454; 10 KiB
-
 Land Labour Graph.jpg 423 × 753; 64 KiB
-
 Leistungsbilanz Schweden.jpg 894 × 452; 42 KiB
-
 Leverage Ratios.png 960 × 720; 8 KiB
-
 LiczInwInd.png 472 × 276; 5 KiB
-
 LiczRachInw.png 472 × 289; 6 KiB
-
 Logisticgrowth.png 946 × 830; 26 KiB
-

-
 Lucas W Cost.JPG 826 × 588; 50 KiB
-
 Macro.jpg 120 × 120; 2 KiB
-
 Macroeconomics by John Lindauer.jpg 261 × 425; 28 KiB
-
 Macroeconomics.PNG 1 261 × 677; 149 KiB
-
 Matriz de transacciones.JPG 492 × 390; 30 KiB
-
 Matriz flujo de transacciones.JPG 417 × 527; 38 KiB
-
 Mepgrouplogo.png 970 × 340; 25 KiB
-
 Model spotřební daně.png 944 × 650; 72 KiB
-
 Mundell-Fleming flexible exchange rate example3.png 882 × 745; 12 KiB
-
 Naunion.png 1 054 × 687; 78 KiB
-
 Naunion.svg 1 711 × 1 992; 88 KiB
-
Nl-modaalinkomen-article.ogg 1 min 54 s; 905 KiB
-
 NMP (Net material Product) per capita - USSR 1990.png 10 527 × 6 651; 1,36 MiB
-
 OECD-Wirtschaftsdaten.png 814 × 561; 53 KiB
-
 OLG-Modell Pivoting around Endowment Point.png 1 335 × 1 324; 59 KiB
-
 OLG-Modell Übersicht.png 849 × 391; 7 KiB
-
 Opinv.JPG 695 × 714; 45 KiB
-
 Optimale Staatsquote.png 900 × 600; 26 KiB
-
 Partage va.png 804 × 489; 58 KiB
-
 Peacock-Wiseman Hypothesis.jpg 2 187 × 1 623; 102 KiB
-
 Pengemengden m0-m2 1996 2011.png 746 × 452; 27 KiB
-
 Phase diagram of the Ramsey model.svg 1 313 × 1 875; 2,14 MiB
-
 Phases.jpg 365 × 324; 23 KiB
-
 PIB 1929-1939.gif 596 × 410; 11 KiB
-
 PIB par habitant de la France.png 674 × 422; 26 KiB
-
 PIB par habitant en France 1820-2003.svg 512 × 361; 63 KiB
-
 PIIGS Mk 4 map.png 3 180 × 1 485; 339 KiB
-
 Praxisbeispiel-Dollarabwertung.png 800 × 391; 49 KiB
-
 Preisindex brd 09.png 2 000 × 1 685; 535 KiB
-
 Price of oil (2003-2008) (cropped).png 969 × 701; 14 KiB
-
 Price of oil (2003-2008).png 1 027 × 771; 39 KiB
-
 Produktionsmulighedsområde.JPG 872 × 539; 35 KiB
-
 Produttività.png 572 × 322; 218 KiB
-
 Publicspending.jpg 458 × 218; 56 KiB
-
 Push-pull-inflation.jpg 420 × 300; 14 KiB
-
 Real US GDP per capita in 5 epocs.svg 504 × 504; 24 KiB
-
 Real US GDP per capita.svg 504 × 504; 17 KiB
-
 Recession2001.PNG 964 × 502; 20 KiB
-
 RelativerLohn.svg 911 × 692; 15 KiB
-
 Repo.jpg 329 × 217; 16 KiB
-
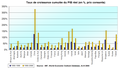
 Reporänta månaktligt genomsnitt 1994 till 2010.JPG 511 × 292; 36 KiB
-
 Reswitching.PNG 970 × 604; 30 KiB
-
 RevenueTaxEffort.png 600 × 279; 40 KiB
-
 Rsquare.jpg 942 × 586; 45 KiB
-
 Répartition valeur ajoutée France.png 1 036 × 697; 44 KiB
-
 SamHicks.PNG 970 × 604; 23 KiB
-
 Samuelson condition.png 960 × 720; 11 KiB
-
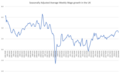 Seasonally Adjusted Average Weekly Wage Growth in the UK.png 1 338 × 812; 106 KiB
-
 SIEPA logo.jpg 200 × 200; 21 KiB
-
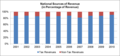 SourcesofRevenues.png 600 × 279; 29 KiB
-
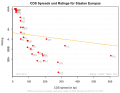 SovCDS-rating de.svg 702 × 540; 155 KiB
-
 Stagflácia.svg 278 × 128; 64 KiB
-
 Stocks to use ag Indicators market 1977 2007.png 502 × 330; 39 KiB
-
 Structural & Cyclical Components of Budget, jjron, 21.05.2013.gif 728 × 480; 19 KiB
-
 Struktura organizacyjna Trybunału Rewidentów Księgowych.svg 1 200 × 1 200; 323 KiB
-
 Subprime crisis - Foreclosures & Bank Instability.png 960 × 720; 16 KiB
-
 Suppy & Demand Curve for Free Trade article.jpg 600 × 620; 42 KiB
-
 Tabelle Ausbildungsbetriebsquoten 2007 für Wiki 1.jpg 617 × 817; 167 KiB
-
 Tasa-inflacion.jpeg 645 × 600; 112 KiB
-

-
 Tuotannon ja kulutuksen teoria.png 855 × 361; 7 KiB
-
 UK house prices adjusted for inflation.png 758 × 503; 4 KiB
-
 Untitled drawing (1).jpg 960 × 720; 36 KiB
-
 V a industrie (euros).png 480 × 346; 15 KiB
-
 Va industrie france.png 480 × 346; 14 KiB
-
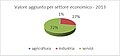 Valore aggiunto settori economici Lombardia 2013.jpg 514 × 241; 15 KiB
-
 Wage labour 2.svg 434 × 359; 9 KiB
-
Water, energy and land insecurity in global supply chains.webm 1 min 27 s, 1 920 × 1 080; 9,97 MiB
-
 Weltwirtschaftswachstum.png 908 × 681; 55 KiB
-
 World international reserves june 2007.png 2 753 × 1 400; 176 KiB
-
 Wykres - teoria dochodu permanentnego.JPG 640 × 400; 16 KiB
-
 Импортозамещение.png 673 × 1 047; 26 KiB
-
 Картинка 06.gif 550 × 242; 20 KiB
-
 Квазистабильное равновесие Лейбенстайна.jpg 586 × 424; 29 KiB
-
 Модель Тюнена -Лаунхардта.png 597 × 641; 55 KiB
-
 Порочный круг нищеты Лейбенстайна.jpg 623 × 470; 55 KiB
-
 Порочный круг нищеты Р. Нурксе.png 1 350 × 764; 39 KiB
-
 Сбалансированный рост в закрытой дуалистической экономике.jpg 973 × 643; 74 KiB
-
 Сбалансированный рост в открытой дуалистической экономике.jpg 973 × 643; 83 KiB
-
 Слободан Петковић.jpg 173 × 202; 18 KiB
-
 Трансакционный спрос на деньги.jpg 216 × 187; 13 KiB
-
 《人民公社好》封面.jpg 64 × 100; 1 KiB
-
 日本の実質GDPの推移.jpg 1 073 × 490; 83 KiB
-
 日本の実質GDP増加率の推移.jpg 1 108 × 485; 85 KiB
-
 金砖四国GDP增长率.jpg 1 000 × 438; 162 KiB


.png)


_per_capita_-_USSR_1990.png)


_(cropped).png)
.png)


.jpg)
.png)


