Category:Neuroscience
Saltar para a navegação
Saltar para a pesquisa
- (pt) Neurociência
- (ar) علوم عصبية
- (bn) স্নায়ুবিজ্ঞান
- (de) Neurowissenschaften
- (en) Neuroscience
- (eo) Neŭrologio
- (es) Neurociencia
- (fa) عصبشناسی
- (fi) Neurotiede
- (fr) Neurosciences
- (he) מדעי המוח
- (hu) Idegtudomány
- (id) Neurosains
- (is) Taugavísindi
- (it) Neuroscienze
- (ja) 神経科学
- (lt) Neuromokslai
- (nl) Neurowetenschap
- (oc) Neurosciéncia
- (pl) Neurobiologia
- (ro) Neuro-ştiinţa
- (ru) Нейробиология
- (sv) Neurovetenskap
- (ta) நரம்பணுவியல்
- (th) ประสาทวิทยาศาสตร์
- (tr) Nörobilim
- (ur) علم الاعصاب
- (zh) 神经科学
estudo científico do sistema nervoso central | |||||
| Carregar ficheiro | |||||
| Instância de |
| ||||
|---|---|---|---|---|---|
| Subclasse de | |||||
| Parte de | |||||
| Composto de | |||||
| Diferente de | |||||
| Diz-se ser o mesmo que | brain science, neurology | ||||
| Coincide parcialmente com | |||||
| |||||
Subcategorias
Esta categoria contém as seguintes 57 subcategorias (de um total de 57).
*
?
A
B
- Biological motion (5 F)
C
D
E
H
I
L
- Libet's experiments (8 F)
M
- Media from Frontiers in Neuroscience (156 F)
N
- Neuroimmunology (5 F)
O
P
R
S
T
U
V
Páginas na categoria "Neuroscience"
Esta categoria só contém a seguinte página.
Multimédia na categoria "Neuroscience"
Esta categoria contém os seguintes 200 ficheiros (de um total de 408).
(página anterior) (página seguinte)-
 1-s2.0-S0967586810002766-gr2.jpg 549 × 354; 78 kB
-
 10.1371 journal.pbio.0050169.g001-O.jpg 450 × 466; 59 kB
-
 1417 Ascending Pathways of Spinal Cord.jpg 2 271 × 2 325; 1,18 MB
-
 1418 Auditory Brainstem Mechanisms.jpg 1 033 × 2 560; 607 kB
-
 15 intelligence knowing-neurons.jpg 838 × 1 024; 61 kB
-
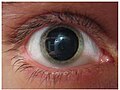 1513 Mydriasis.jpg 1 642 × 1 238; 1,46 MB
-
 1P cultured neuron.png 582 × 686; 61 kB
-
 1P HEK293.png 618 × 671; 66 kB
-
 1P hESC-CM.png 711 × 518; 77 kB
-
 1P iPSC-CM.png 741 × 554; 77 kB
-
 2010-3-15 rGFAP 1-4000 1-200 Hip 20x(4).tif 2 040 × 1 536; 8,99 MB
-
 2017 Study.png 1 080 × 1 920; 355 kB
-
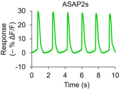
 2P sliceCulture 50usDwell.png 785 × 741; 105 kB
-
 A Psychophysics Experiment on the Control of Reaching Movements.png 1 370 × 923; 2,26 MB
-
 A-SET Mind Controlled Wheelchair 2.jpg 5 472 × 3 648; 1,51 MB
-
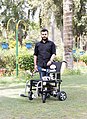 A-SET Mind Controlled Wheelchair.jpg 3 648 × 5 008; 1,59 MB
-
 Achucarro Basque Center for Neuroscience.png 250 × 101; 27 kB
-
 Activity of a monkey pyramidal-tracts neuron during precision and power grip.png 1 047 × 529; 153 kB
-
 Additive response.png 532 × 423; 52 kB
-
 After Asanuma & Okuda 1962 Fig9.jpg 5 353 × 3 342; 2,34 MB
-
 Agrincartoon2.png 430 × 325; 59 kB
-
 Alcohol effects on GABRA2.jpg 1 280 × 1 150; 47 kB
-
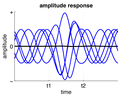 Amp response.png 532 × 423; 58 kB
-
 AndamEm.jpg 695 × 936; 28 kB
-
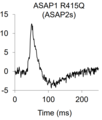
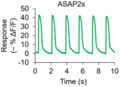
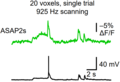 ASAP2s 2P sliceCulture single trial trace.png 754 × 513; 65 kB
-
 Ascending pain pathways.tif 1 563 × 1 812; 551 kB
-

-
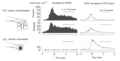
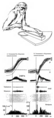
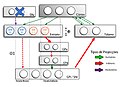
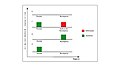 Ativação dos neurónios dopaminérgicos em função da previsão ou da recompensa.jpg 1 366 × 768; 166 kB
-
 Autocorrelation image.jpg 456 × 342; 26 kB
-
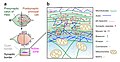
 Average Regional Connection Matrix, Network Layout, and Connectivity Backbone.png 4 105 × 2 890; 4,5 MB
-
 AxialTwistDevelopment.png 763 × 1 220; 479 kB
-
 AxialTwistScenario.png 642 × 310; 132 kB
-
 BarkerHWNI.jpg 2 048 × 1 536; 851 kB
-
 Bastonetes células bipolares e celulas ganglionares centro-periferia.png 1 461 × 787; 375 kB
-
 Bastonetes e células bipolares no claro e no escuro com glutamato.png 1 133 × 937; 124 kB
-
 BDNF NT4.png 5 000 × 6 600; 10,46 MB
-
 Behaviouracy.png 937 × 1 080; 91 kB
-
 Biologically synchronized finger motion.svg 333 × 199; 154 kB
-
 Boerger2023LSBN.jpg 3 200 × 3 028; 1,69 MB
-
 Boundary cell.png 640 × 320; 75 kB
-
 Brainbow Genetic Construct.png 612 × 297; 60 kB
-
 BrainToSpecificityToScoreLenght5.png 800 × 600; 130 kB
-
 BrandonScienceRatDataMovieApril19.gif 436 × 344; 3,61 MB
-
 Building a Demand Based Memory.pdf 1 275 × 1 650, 6 páginas; 112 kB
-
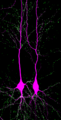 CA1 pyramidal cells with synapses.png 455 × 894; 277 kB
-
 Calyx of Held Model.jpg 3 655 × 1 880; 1,78 MB
-
 Calyx of Held synapse.svg 1 063 × 547; 499 kB
-
 Calyx of Held v3.svg 1 063 × 547; 542 kB
-
 Campenot Chamber.tif 1 383 × 1 349; 5,91 MB
-
-
 CAPON mRNA Short-Form Expression by Diagnosis.png 2 012 × 1 189; 83 kB
-
 Cascade ischémique 01.png 1 155 × 749; 30 kB
-
 Cascade ischémique 02.svg 1 153 × 749; 11 kB
-
 Castro2015 ar.png 1 000 × 1 146; 634 kB
-
 Castro2015.jpg 767 × 879; 177 kB
-
 Central Amygdala Connections.pdf 1 666 × 3 125; 491 kB
-
 Cerebro - palestra.jpg 4 000 × 6 000; 6,5 MB
-
 CFos-expression-in-stimulated-neurons.jpg 2 010 × 1 000; 971 kB
-
-
 Cholinergic-7.gif 109 × 150; 15 kB
-
 Cholinergic-7.jpg 946 × 1 300; 127 kB
-
 Christian and Thompson Figure 5 SVG.svg 990 × 765; 39 kB
-
 Chronische Exzitotoxizität.svg 990 × 861; 66 kB
-
 Circuits-for-imaginations.png 2 576 × 2 265; 327 kB
-
 Coding of direction of 3D reaching in motor cortex.png 3 437 × 672; 271 kB
-
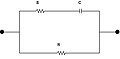 Cole cole circuit.jpg 606 × 297; 15 kB
-
 Comparative evolution of the striatum and pallium in vertebrates.png 2 902 × 1 370; 2,45 MB
-
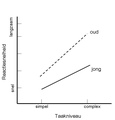 Complex.PNG 608 × 636; 14 kB
-
 Computational Neuroaesthetics.png 1 024 × 768; 98 kB
-
 Conrad74.png 626 × 1 373; 404 kB
-
 Constudintralam.jpg 720 × 540; 72 kB
-
 Constudsynch.gif 613 × 577; 8 kB
-
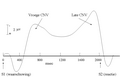 Contingent negative variation (CNV) with Dutch text.png 841 × 541; 21 kB
-
 Cortical Layers.png 3 840 × 2 160; 14,74 MB
-
 Cortical Minicolumn.png 1 920 × 1 920; 4,72 MB
-
 CoverJMN.jpg 427 × 600; 97 kB
-
 Cpg output.jpg 1 201 × 901; 162 kB
-
 CREB cAMP neuron pathway png.png 583 × 849; 101 kB
-
 CREB cAMP neuron pathway.svg 512 × 772; 15 kB
-
 Mapa prp.png 243 × 650; 8 kB
-
 Critical Period.png 550 × 373; 10 kB
-
 Crossed surround inhibition feedforward.jpg 5 353 × 3 342; 2,91 MB
-
 Crossed surround inhibition recurrent.jpg 5 353 × 3 342; 2,9 MB
-
 Current research in therapeutic interventions.png 3 315 × 2 393; 2,51 MB
-
 DCM for ERP and CMC.svg 640 × 436; 51 kB
-
 Default Mode Network Connectivity (cropped).png 1 263 × 969; 1,48 MB
-
 Default Mode Network Connectivity.png 3 491 × 7 927; 32,23 MB
-
 Demiel f.jpg 354 × 245; 35 kB
-
 Dendritic spike.png 1 147 × 790; 82 kB
-
 Dipool.PNG 210 × 384; 38 kB
-
 Directional tuning of a motor cortical neuorn.png 636 × 1 174; 299 kB
-
-
-
 Dissociation of the correlation between cell and muscle activity.png 1 958 × 568; 75 kB
-
-
 Dorsal and ventral attention systems.jpg 878 × 498; 106 kB
-
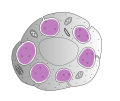
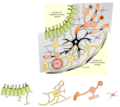 DrPaulineNeveu 01 GlieSNC cellules separees.png 732 × 653; 206 kB
-
 DrPaulineNeveu 01 MyeliniqSchwann.png 630 × 501; 71 kB
-
 DrPaulineNeveu 02 PA trace.svg 899 × 1 505; 108 kB
-
 DrPaulineNeveu 02 Systemes 5HT.svg 975 × 653; 892 kB
-
 DrPaulineNeveu 02 Systemes A.svg 975 × 653; 875 kB
-
 DrPaulineNeveu 02 Systemes Ach.svg 975 × 653; 887 kB
-
 DrPaulineNeveu 02 Systemes DA.svg 976 × 655; 886 kB
-
 DrPaulineNeveu 02 Systemes HA.svg 975 × 653; 883 kB
-
 DrPaulineNeveu 02 Systemes NA.svg 975 × 653; 888 kB
-
 DrPaulineNeveu 03 Allometrie ME et colonne vertebrale.svg 1 872 × 882; 375 kB
-
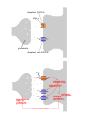
 DrPaulineNeveu 03 Apparition Vesicules.png 1 258 × 623; 199 kB
-
 DrPaulineNeveu 03 Axe hypothalamus hypophyse.png 1 078 × 848; 306 kB
-
 DrPaulineNeveu 03 EEG potentiels evoques.svg 683 × 369; 66 kB
-
 DrPaulineNeveu 03 Embryo SNC courbures.svg 516 × 865; 29 kB
-
 DrPaulineNeveu 03 Hypothalamus epaisseur noyaux.svg 1 723 × 628; 140 kB
-
 DrPaulineNeveu 03 Myelomeres et dermatomes.svg 404 × 825; 139 kB
-
 DrPaulineNeveu 03 SNC LCR circulation.svg 200 × 387; 37 kB
-
 DrPaulineNeveu 03 Tube neural cadre d etude.svg 647 × 550; 44 kB
-
 DrPaulineNeveu 04 Langue et gouts.svg 277 × 618; 24 kB
-
 DrPaulineNeveu 05 Actine molecule.svg 813 × 157; 29 kB
-
 DrPaulineNeveu 05 Contraction muscle cinq etapes.svg 3 597 × 1 149; 97 kB
-
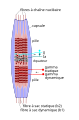
 DrPaulineNeveu 05 Fibre musculaire entiere schematisee.svg 255 × 838; 17 kB
-
 DrPaulineNeveu 05 myosine bouquet.svg 477 × 168; 11 kB
-
 DrPaulineNeveu 05 Myosine molecule.svg 520 × 223; 14 kB
-
 DrPaulineNeveu 05 Sarcomere schema actine myosine.svg 547 × 327; 239 kB
-
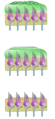
 DrPaulineNeveu 05 Secousse fibres rapide interm lente.svg 945 × 832; 143 kB
-
 DrPaulineNeveu 05 Secousse musculaire.svg 575 × 249; 14 kB
-
 DrPaulineNeveu 05 Secousse sommation.svg 500 × 638; 24 kB
-
 DrPaulineNeveu 05 Tetanos.svg 905 × 361; 35 kB
-
 DrPaulineNeveu 05 Tissu conjonctif endo peri epimysium.svg 593 × 602; 408 kB
-
 DrPaulineNeveu 06 Homonculus senso et moteur.svg 563 × 282; 54 kB
-
 DrPaulineNeveu 06 Voies lemniscales.svg 367 × 533; 847 kB
-
 DrPaulineNeveu 06 Voies spino cerebelleuses.svg 343 × 521; 835 kB
-
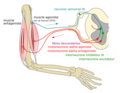
 DrPaulineNeveu 07 FNM detail.svg 611 × 921; 96 kB
-
 DrPaulineNeveu 07 Locomotion mvt corps.svg 375 × 248; 9 kB
-
 DrPaulineNeveu 07 Marche humaine poser lever.svg 569 × 209; 58 kB
-
 DrPaulineNeveu 07 Mb sup Reflexe Inhibition autogeniq.png 1 044 × 810; 215 kB
-
 DrPaulineNeveu 07 Mb sup Reflexe Myotatique.png 1 098 × 818; 221 kB
-
 DrPaulineNeveu 07 OTG detail.png 409 × 626; 85 kB
-
 DrPaulineNeveu 07 Poser lever pendule pendule inverse.svg 230 × 162; 10 kB
-
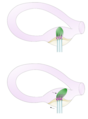 DrPaulineNeveu 08 Ampoule canal.png 587 × 797; 87 kB
-
 DrPaulineNeveu 08 Cellule ciliee cupule.png 399 × 860; 151 kB
-
 DrPaulineNeveu 08 Inclinaison tete et acceleration voiture.png 1 055 × 739; 281 kB
-
 DrPaulineNeveu 08 Liens Vestib Muscles oculomoteurs.svg 309 × 339; 111 kB
-
 DrPaulineNeveu 08 Voies Vestibulaires.svg 324 × 512; 832 kB
-
 DrPaulineNeveu 09 Voies Reticulaires.svg 315 × 493; 819 kB
-
 DrPaulineNeveu 10 Voies CorticoNucleaires.svg 585 × 579; 820 kB
-
 DrPaulineNeveu 10 Voies CorticoReticuloSpinales.svg 585 × 579; 816 kB
-
 DrPaulineNeveu 10 Voies CorticoRubroSpinales.svg 585 × 579; 812 kB
-
 DrPaulineNeveu 10 Voies CorticoSpinales.svg 585 × 579; 830 kB
-
 DrPaulineNeveu 10 Voies CorticoTectoSpinales.svg 585 × 579; 816 kB
-
 DrPaulineNeveu 10 Voies CorticoVestibuloSpinales.svg 585 × 579; 814 kB
-
 DrPaulineNeveu 12 OldsMilnerSelfStimulation.svg 927 × 639; 36 kB
-
 DrPaulineNeveu 13 Voies dorsale ventrale.svg 822 × 543; 19 kB
-
 DrPaulineNeveu 14 EEG technique.svg 551 × 265; 56 kB
-
 DrPaulineNeveu 14 Modes transmission burst.svg 550 × 813; 41 kB
-
 DrPaulineNeveu 15 PLT.svg 551 × 774; 72 kB
-
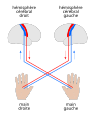 DrPaulineNeveu 16 Controle controlateral mains.svg 526 × 646; 61 kB
-
 DrPaulineNeveu 16 Test Wada.svg 437 × 389; 17 kB
-
 DrPaulineNeveu Schwann cell cellule unmyelinated amyelinique.svg 412 × 346; 68 kB
-
 Drug Brain Activity.jpg 1 500 × 999; 315 kB
-
 Dup15q EEG signature.png 1 597 × 756; 499 kB
-
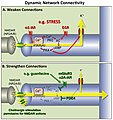 Dynamic Network Connectivity.jpg 1 625 × 1 727; 383 kB
-
 Dynamical model of Rokni-Sompolinsky.png 881 × 1 025; 115 kB
-
 Ed Evarts experiment with monkey 1968.png 734 × 459; 80 kB
-
 EDSS Thinking and Memory.png 2 406 × 560; 99 kB
-
 EEG 10-10 system with additional information.svg 512 × 341; 100 kB
-
 EEG 10-10 system.svg 512 × 526; 73 kB
-
 EEG Brainwaves.svg 512 × 478; 52 kB
-
 EEG Neurotech.jpg 234 × 176; 31 kB
-
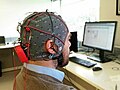
 EEG recording.jpg 960 × 717; 135 kB
-
 EEG time series 62 channels.svg 512 × 348; 325 kB
-
 Egad isoforms rat brain diff ages.png 1 993 × 3 932; 855 kB
-
 Ekscitotoksičnost.png 1 000 × 859; 213 kB
-
 EL IMAGOTIPO CHAPTER PERU Sociedad de Neurociencia.png 952 × 444; 43 kB
-
 Electron micrograph of a Fractone.jpg 3 662 × 3 472; 2,37 MB
-
 Encéfalo.jpg 428 × 306; 61 kB
-
 Epigenese.PNG 442 × 672; 28 kB
-
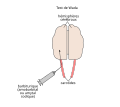
 Equipamento Estereotáxico Teixeira-Martos TM-02B.png 268 × 196; 49 kB
-
 Eriksen.PNG 540 × 400; 11 kB
-
 Espinas dendríticas.jpg 300 × 445; 42 kB
-
-
 Examples of global remapping and rate remapping..png 1 752 × 917; 2,08 MB
-
 Experiment Caminiti et al 1991.png 1 078 × 1 056; 75 kB
-
 Explaing away rus.png 200 × 241; 7 kB
-
 FENS-LOGO-blue.jpg 1 181 × 278; 141 kB
-
 Figure1 interactome highres.tif 1 716 × 1 256; 1,04 MB
-
 Firing patterns.png 903 × 693; 442 kB
-
 Fitzhugh-nagumo b = 0.8.gif 1 600 × 1 600; 52,64 MB
-
 Fitzhugh-nagumo b = 1.25.gif 1 600 × 1 600; 56,48 MB
-
 Fitzhugh-nagumo b = 2.0, separatrix.png 1 260 × 1 297; 958 kB
-
 Fitzhugh-nagumo b = 2.0.gif 1 600 × 1 600; 63,72 MB
-
 FitzHugh-Nagumo Model.png 1 333 × 1 317; 204 kB
-
 Five different phases of nerve regeneration inside a hollow NGC.jpg 536 × 695; 239 kB
-
 Flipflop 2.PNG 560 × 343; 11 kB
-
 Fnbeh-08-00171-g002.jpg 850 × 636; 191 kB
-
 Fnins-14-00754-g002.jpg 2 250 × 1 807; 401 kB
-

-
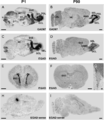
 FoxP2+TH sagittal.jpg 1 973 × 1 614; 485 kB
-
 Freq response.png 532 × 423; 84 kB
-
 Frequency rate chart example.jpg 1 070 × 616; 62 kB
-
 Functional unit of callosal influence.jpg 4 763 × 4 096; 5,05 MB
-
 Gad1 transcripts in the developing vibrissae.jpg 1 200 × 2 018; 131 kB
-
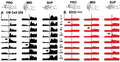
 Gad65 and gad67 in rat brain diff ages.png 2 807 × 1 821; 925 kB


_with_Dutch_text.png)


.png)


_and_P90_(right_panels).png)


