Category:Normal distribution
Vai alla navigazione
Vai alla ricerca
distribuzione di probabilità continua  | |||||
| Carica un file multimediale | |||||
| File audio dell'elemento | |||||
|---|---|---|---|---|---|
| Sottoclasse di |
| ||||
| Aspetto di | |||||
| Prende il nome da | |||||
| |||||
Normal distribution, also called Gaussian distribution.
Sottocategorie
Questa categoria contiene le 9 sottocategorie indicate di seguito, su un totale di 9.
File nella categoria "Normal distribution"
Questa categoria contiene 200 file, indicati di seguito, su un totale di 306.
(pagina precedente) (pagina successiva)-
De-Gauß-Verteilung.ogg 2,0 s; 20 KB
-
De-Gaußkurve.ogg 1,8 s; 18 KB
-
De-Normalverteilung.ogg 2,3 s; 22 KB
-
 001 Dwustronny obszar krytyczny.svg 1 411 × 887; 10 KB
-
 002 Lewostronny obszar krytyczny.svg 1 411 × 887; 5 KB
-
 003 Prawostronny obszar krytyczny.svg 1 411 × 887; 5 KB
-
 08fig-empirical.png 700 × 432; 35 KB
-
 08fig-standardize.png 1 170 × 373; 60 KB
-
 2AFC task, normal distribution model.png 355 × 403; 22 KB
-
 2D Normally Distributed Points.png 600 × 400; 27 KB
-
 A-normal-distribution-with-areas-under-curve-1.png 3 900 × 2 400; 194 KB
-

-
 Angenäherte Gaußglocke(5*5).JPG 465 × 462; 23 KB
-
 Anpassungstests.svg 703 × 468; 65 KB
-
 Anscombe transform animated.gif 800 × 400; 849 KB
-
 Antropoloogia õppetahvel. Eesti meeste kehapikkuse modifikatsioon.jpg 4 282 × 3 123; 1,76 MB
-
 Assss.png 443 × 173; 3 KB
-
 Banakuntza normala histograma 01.png 480 × 480; 15 KB
-
 Bell curve of intake versus health effect.svg 1 394 × 906; 11 KB
-
 Bell Curve Showing 100 Faces to Illustrate Percentile Rank.png 765 × 325; 30 KB
-
 Bell telephone magazine (1922) (14569352030).jpg 2 018 × 1 440; 330 KB
-
 Bellcurve.svg 512 × 320; 662 byte
-
 Bernoulli normalfördelning graf.png 319 × 142; 4 KB
-
 Bernoulli12.png 256 × 192; 2 KB
-
 Bernoulli60.png 256 × 192; 975 byte
-
 Bertillon - Identification anthropométrique (1893) 041.png 852 × 524; 583 KB
-
 Bi normal.pdf 900 × 900; 5 KB
-
 BinDistApprox large.png 504 × 481; 18 KB
-
 Binomial Distribution.svg 1 008 × 962; 39 KB
-
 Boston Winter Snowfall Counts Distribution.png 1 113 × 783; 96 KB
-
 Bound.png 754 × 615; 26 KB
-
 Bounded probability distributions, compared with the normal distribution.svg 1 080 × 900; 46 KB
-
 Boxplot vs PDF-be.svg 598 × 652; 492 KB
-
 Boxplot vs PDF.png 703 × 731; 9 KB
-
 Boxplot vs PDF.svg 598 × 652; 493 KB
-
 ClassementELOFIDE2008.jpg 1 168 × 703; 90 KB
-
 CLTBinomConvergence.svg 1 012 × 650; 33 KB
-

-
 Comparing normal distributions 001.png 745 × 500; 50 KB
-
 Confidence Interval 90P.png 400 × 263; 10 KB
-
 Confidence interval and standard score.png 2 450 × 2 450; 468 KB
-
 Confidence intervals for different confidence levels.gif 1 200 × 687; 40 KB
-
 ConfIntervNormalP.png 494 × 297; 6 KB
-
 Contrainte resistance 2d eloigne.svg 523 × 445; 126 KB
-
 Contrainte resistance 2d proche.svg 511 × 445; 127 KB
-
 Cp 0.00.png 807 × 435; 11 KB
-
 Cp 1.00.png 807 × 435; 11 KB
-
 Cp 1.33.png 807 × 435; 12 KB
-
 Cp 1.66.png 807 × 435; 12 KB
-
 Critique of the Theory of Evolution Fig 074.jpg 648 × 336; 11 KB
-
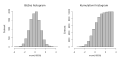 Cumulative vs normal histogram cz.svg 900 × 450; 67 KB
-
 Cumulative vs normal histogram.svg 900 × 450; 52 KB
-
 Curva a campana.png 1 240 × 705; 76 KB
-
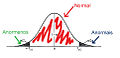 Curva Anormal.jpg 482 × 232; 42 KB
-
 Curva Gaussiana.png 537 × 303; 17 KB
-
 Curva normal 2.jpg 711 × 375; 30 KB
-
 Curva normal.JPG 293 × 180; 9 KB
-
 Darstellung des Conditional Value at Risk.png 2 333 × 1 147; 115 KB
-
 De moivre-laplace.gif 250 × 155; 21 KB
-
 Densnormdis.PNG 515 × 374; 51 KB
-
 Desommation gaussienne lorentzienne.svg 610 × 460; 59 KB
-
 Desommation trois pics gaussiens.svg 610 × 460; 128 KB
-
 Diagramma standaardafwijking.png 476 × 202; 8 KB
-
 Discrete Gaussian kernel.svg 450 × 538; 35 KB
-
 Discrete Gaussians.svg 428 × 495; 66 KB
-
 DisNormal.svg 1 700 × 700; 15 KB
-
 DisNormal02.svg 1 700 × 700; 14 KB
-
 DisNormal03.svg 1 700 × 700; 15 KB
-
 DisNormal04.svg 1 700 × 700; 15 KB
-
 DisNormal05.svg 1 700 × 700; 16 KB
-
 DisNormal06.svg 1 700 × 700; 16 KB
-
 DisNormal07.svg 1 700 × 700; 14 KB
-
 DisNormal08.svg 1 700 × 700; 15 KB
-
 DisNormal09.svg 1 700 × 700; 15 KB
-
 DisNormal10.svg 1 700 × 700; 15 KB
-
 Distribuciongaussiana.JPG 474 × 272; 9 KB
-
 Distribusi Sigma.gif 905 × 370; 46 KB
-
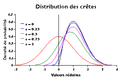 Distribution des crêtes.png 314 × 206; 4 KB
-
 Double Gauss.png 384 × 192; 3 KB
-
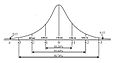
 EB1911 Probability - probability-curve.jpg 758 × 609; 36 KB
-
 EMG Distribution CDF.png 480 × 480; 45 KB
-
 EMG Distribution PDF.png 480 × 480; 53 KB
-
-
 Empirical Rule Normal Distribution.png 1 107 × 599; 31 KB
-
 Es15p140.png 770 × 544; 8 KB
-
 Exp squared function.svg 1 300 × 975; 8 KB
-
 ExTableNorm.PNG 311 × 306; 11 KB
-
 E^(-x^2).svg 600 × 480; 14 KB
-
 Fehler Normal.svg 480 × 280; 18 KB
-
 Fehler Streuung.svg 480 × 290; 17 KB
-
 Fig3.png 560 × 420; 5 KB
-
 Fisher iris versicolor sepalwidth.svg 822 × 567; 17 KB
-
 Folded normal pdf.svg 640 × 360; 42 KB
-
 Folded-cumulative-distribution-function.svg 619 × 507; 106 KB
-
 Fonction caracteristique normale.svg 425 × 284; 21 KB
-
 Gausian B.png 606 × 297; 12 KB
-
 Gausienne.png 182 × 178; 2 KB
-
 Gauss and Lorentz lineshapes.png 500 × 357; 15 KB
-
 Gauss and Lorentz lineshapes.svg 1 082 × 695; 63 KB
-
 Gauss and Lorentz lineshapes2.png 448 × 290; 3 KB
-
 Gauss distribution.png 600 × 421; 24 KB
-
 Gauss reduite.svg 667 × 451; 24 KB
-
 Gauss-en kanpaia Banaketa normala.svg 704 × 246; 34 KB
-
 Gauss-filter-impulsantwort.PNG 949 × 707; 26 KB
-
 Gauss-Filter-Impulsantwort.svg 526 × 394; 32 KB
-
 Gauss-filter-uebertragungsfunktion.PNG 994 × 701; 36 KB
-
 Gauss-Filter-Uebertragungsfunktion.svg 526 × 394; 75 KB
-
 Gauss-primes-768x768.png 768 × 768; 27 KB
-
 Gauss-sum.svg 1 084 × 688; 66 KB
-
 Gauss1.jpg 370 × 260; 7 KB
-
 Gaussian and Lorentzian profiles.png 1 080 × 720; 52 KB
-
 Gaussian by stevencys.jpg 561 × 420; 16 KB
-
 Gaussian curve ENG.jpg 960 × 720; 33 KB
-
 Gaussian curve.svg 709 × 222; 4 KB
-
 Gaussian differences.svg 543 × 683; 208 KB
-
 Gaussian distribution 2.jpg 360 × 250; 7 KB
-
 Gaussian distribution darts demonstration.svg 655 × 503; 13 KB
-
 Gaussian distribution log-lin plot.png 481 × 311; 14 KB
-
 Gaussian distribution log-log plot.png 501 × 311; 13 KB
-
 Gaussian distribution thick lines.svg 772 × 549; 3 KB
-
 Gaussian distribution.svg 210 × 100; 5 KB
-
 Gaussian Filter.svg 700 × 502; 19 KB
-
 Gaussian function graph (52,12) vs (52,24).gif 471 × 171; 3 KB
-
 Gaussian function graph (52,24).gif 416 × 171; 2 KB
-
 Gaussian function graph (52,6) vs (52,12).gif 360 × 236; 3 KB
-
 Gaussian function graph.png 720 × 460; 49 KB
-
 Gaussian Histogram 10million samples 100K bins.png 1 914 × 943; 13 KB
-
 Gaussian mechanism.png 528 × 411; 22 KB
-
 Gaussian wave packet.svg 512 × 386; 2 KB
-
 Gaussian, Lorentzian and Voigt profiles.png 1 080 × 720; 65 KB
-
 Gaussian-mixture-example.png 300 × 250; 13 KB
-
 Gaussiana a due code.png 402 × 259; 4 KB
-
 Gaussiana a una coda.png 402 × 259; 4 KB
-
 Gaussoarithmetique.svg 1 201 × 1 394; 73 KB
-
 Gaussova distribuce.png 579 × 408; 19 KB
-
 Gaussova křivka.jpg 803 × 296; 29 KB
-
 Generalized normal densities.svg 720 × 540; 110 KB
-
 Grafico distribuzione Frequenze - Prezzi.JPG 797 × 612; 74 KB
-
 Gráfico da função gaussiana.svg 800 × 480; 32 KB
-

-
 Histogramm.png 431 × 378; 12 KB
-
 Histogramme loi normale 50 ech numpy pyplot.png 375 × 252; 3 KB
-
 Histogramme loi normale.svg 563 × 438; 17 KB
-
 Hores solars pic.png 711 × 380; 5 KB
-
 Interdisz.png 110 × 110; 3 KB
-
 IQ - distribuição simétrica.gif 650 × 468; 409 KB
-
 IQ curve (2).svg 600 × 480; 9 KB
-
 IQ curve.png 781 × 491; 7 KB
-
 IQ curve.svg 600 × 480; 9 KB
-
 IQ Distributions and Occupations.jpg 1 028 × 765; 131 KB
-
 Iqr with quantile.png 742 × 428; 27 KB
-
 Iqr.png 1 024 × 584; 12 KB
-
 Jamama Planar Plots.jpg 560 × 420; 16 KB
-
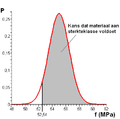 Karakteristieke sterkte.PNG 406 × 403; 9 KB
-
 Konfidenz.png 798 × 443; 22 KB
-
 Laplace mechanism.png 528 × 417; 22 KB
-
Mathematrix Normalverteilung BRP.webm 14 min 43 s, 609 × 411; 34,85 MB
-
 Maximum de vraisemblance dispersion loi normale centree reduite.svg 1 594 × 773; 204 KB
-
 Maximum de vraisemblance position loi normale centree reduite.svg 1 126 × 838; 167 KB
-
 Mean estimator consistency.gif 800 × 325; 4,53 MB
-
 Mplwp expnegxsqr.svg 600 × 400; 20 KB
-
 Mplwp gaussian logscale.svg 600 × 400; 43 KB
-
 Mplwp gaussian wavepacket f4.svg 600 × 400; 38 KB
-
 Mplwp gaussian.svg 600 × 400; 23 KB
-
 Mplwp Voigt-0,03,07,1.svg 600 × 400; 37 KB
-
 Mplwp Voigt-0,05,1.svg 600 × 400; 37 KB
-
 Mplwp Voigt-HWHM1.svg 600 × 400; 41 KB
-
 Mplwp Voigt-samemax.svg 600 × 400; 38 KB
-
 Nieznormalizowane radialne funkcje bazowe.png 694 × 467; 9 KB
-
 Normal approximation to binomial.png 1 300 × 975; 92 KB
-
 Normal approximation to binomial.svg 600 × 480; 18 KB
-
 Normal density-2.svg 931 × 715; 43 KB
-
 Normal density.svg 800 × 600; 7 KB
-
 Normal dist density cumulative 0001.jpg 3 600 × 4 700; 604 KB
-
 Normal distribution and scales tr.gif 1 200 × 687; 41 KB
-
 Normal distribution and scales.gif 1 200 × 687; 39 KB
-
 Normal Distribution CDF Diagram (z≤0).svg 200 × 100; 16 KB
-
 Normal Distribution CDF Diagram.svg 200 × 100; 18 KB
-
 Normal distribution curve with all below upper tail shaded.jpg 206 × 127; 4 KB
-
 Normal distribution curve with lower tail shaded.jpg 206 × 127; 5 KB
-
 Normal distribution curve with lower to upper tail shaded.jpg 206 × 127; 4 KB
-

-
-

-

-
 Normal distribution curve with middle shaded.jpg 206 × 127; 4 KB
-
 Normal distribution curve with tails shaded.jpg 206 × 127; 4 KB
-
 Normal distribution curve with upper tail shaded.jpg 206 × 127; 5 KB
-
 Normal distribution curve.jpg 206 × 127; 5 KB
-
 Normal Distribution Far-Right CDF Diagram.svg 200 × 100; 16 KB
-
 Normal distribution function.png 1 597 × 869; 70 KB
-
 Normal Distribution NIST.gif 422 × 300; 3 KB
-
 Normal distribution of gunshot impact NT.PNG 800 × 640; 49 KB
-
 Normal distribution pdf.png 1 300 × 975; 25 KB
-
 Normal Distribution PDF.png 707 × 444; 47 KB
-
 Normal distribution pdf.svg 600 × 480; 11 KB
-
 Normal Distribution PDF.svg 720 × 460; 63 KB
-
 Normal Distribution Sigma.svg 1 292 × 623; 3 KB
-
 Normal marginals.png 1 000 × 500; 66 KB
-
 Normal-data.jpg 223 × 115; 3 KB


.JPG)


_(14569352030).jpg)


_041.png)


.svg)


_vs_(52,12).gif)


.svg)


.svg)


_vs_(52,24).gif)
.gif)