Category:Public expenditure
Aller à la navigation
Aller à la recherche
ensemble des dépenses réalisées par les administrations publiques d'un état | |||||
| Téléverser des médias | |||||
| Nature de l’élément |
| ||||
|---|---|---|---|---|---|
| Sous-classe de |
| ||||
| Aspect de | |||||
| Réputé identique à | dépenses de l'Etat | ||||
| |||||
See also:
Sous-catégories
Cette catégorie comprend 11 sous-catégories, dont les 11 ci-dessous.
Média dans la catégorie « Public expenditure »
Cette catégorie comprend 38 fichiers, dont les 38 ci-dessous.
-
 1-chart.png 975 × 634 ; 289 kio
-
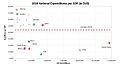 2010 National Spending per GDP comparison.jpg 1 385 × 773 ; 81 kio
-
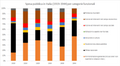
 Arbetsförmedlingens användning av budgeten 2018.png 744 × 829 ; 206 kio
-
 Bowen's Model Graph.JPG 612 × 408 ; 23 kio
-
 Brooklyn Museum - Comme Sisyphe - Honoré Daumier.jpg 619 × 768 ; 114 kio
-
 Budget-to-manage-invasive-alien-species (OWID 0135).png 850 × 600 ; 101 kio
-
 Depense-publique-sur-PIB.png 450 × 422 ; 13 kio
-
 Depense-publique-sur-PIB.svg 450 × 422 ; 82 kio
-
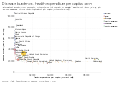 Disease burden vs. health expenditure per capita, OWID.svg 850 × 600 ; 34 kio
-
 Déficit Estado Antiguo régimen.png 2 230 × 1 330 ; 45 kio
-
 Déficit Etat ancien régime.png 2 229 × 1 331 ; 38 kio
-
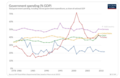
 Expenditure and revenues, France, 1993-2006.png 1 154 × 736 ; 54 kio
-
 Fiscal policy.png 903 × 759 ; 16 kio
-
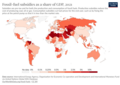 Fossil-fuel-subsidies-gdp-2021.png 3 400 × 2 400 ; 921 kio
-
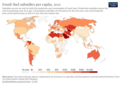 Fossil-fuel-subsidies-per-capita-2021.png 3 400 × 2 400 ; 920 kio
-
Free Software Foundation Europe - Public Money, Public Code (de).webm 3 min 47 s, 1 920 × 1 080 ; 83,54 Mio
-
Free Software Foundation Europe - Public Money, Public Code.webm 3 min 47 s, 1 920 × 1 080 ; 120,33 Mio
-
 FSFE Public Money, Public Code logo sticker.svg 195 × 266 ; 25 kio
-
 Government Expenditure as a Percentage of GDP (2014 Index of Economic Freedom).svg 1 719 × 1 053 ; 81 kio
-
 Government expenditure on tertiary education by country, OWID.svg 850 × 600 ; 140 kio
-
 Government spending, OWID.svg 850 × 600 ; 140 kio
-
 Graphe Dépenses et recettes publiques, France,1993-2006.png 1 154 × 736 ; 37 kio
-
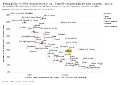 Inequality in life expectancy vs. health expenditure per capita, OWID.svg 850 × 600 ; 36 kio
-
 Life expectancy vs healthcare spending.jpg 1 876 × 1 816 ; 553 kio
-
 Life expectancy vs. health expenditure per capita, OWID.svg 850 × 600 ; 36 kio
-
 Oeffentliche Finanzen.png 793 × 1 123 ; 62 kio
-
 Proportion-of-domestic-budget-funded-by-domestic-taxes-of-gdp.png 3 400 × 2 400 ; 799 kio
-
 Public spending vs. GDP growth.png 918 × 648 ; 101 kio
-
 Ratio dépenses publiques et PIB.png 450 × 475 ; 21 kio
-
 Share of government expenditure going to interest payments, OWID.svg 850 × 600 ; 142 kio
-
 Share of government expenditure spent on health, OWID.svg 850 × 600 ; 141 kio
-
 Share of government expenditure spent on health.png 3 400 × 2 400 ; 839 kio
-
 Social spending.PNG 622 × 445 ; 62 kio
-
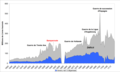
 Spesa pubblica italiana 1919-1944.png 5 441 × 2 999 ; 460 kio
-
 Spesa-per-r-s-1981-2020-.png 1 239 × 789 ; 87 kio
-
 Tax Burden as a Percentage of GDP (2014 Index of Economic Freedom).svg 1 719 × 1 053 ; 79 kio
-

-
 UK budget deficit (2008).svg 744 × 1 052 ; 2 kio


.png)


.svg)


.svg)

.svg)