Category:Sankey diagrams
ナビゲーションに移動
検索に移動
specific type of graphic flow diagram where arrow widths are proportional to the flow rates | |||||
| メディアをアップロード | |||||
| 上位クラス | |||||
|---|---|---|---|---|---|
| 名前の由来 | |||||
| |||||
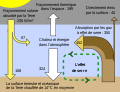
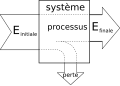
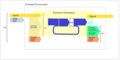
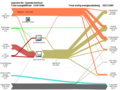
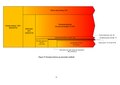
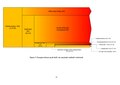
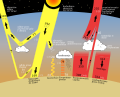
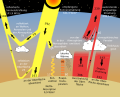
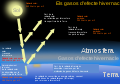
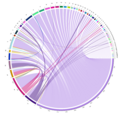
Sankey diagrams are a specific type of flow diagram, in which the width of the arrows is shown proportionally to the flow quantity. They are typically used to visualize energy or material transfers between processes.
カテゴリ「Sankey diagrams」にあるメディア
このカテゴリに属する 118 個のファイルのうち、 118 個を表示しています。
-
 0D1L Radiation Balance Model.svg 694 × 550;109キロバイト
-
 1986 Design Flows.gif 1,000 × 1,388;54キロバイト
-
 Beispiel Sankey Diagramm v2.svg 700 × 500;9キロバイト
-
 Bilan énergétique France 2020 d'après SDES et blocs.png 2,000 × 1,539;314キロバイト
-
 Bilan énergétique France 2020 french energy balance From SDES open data.png 1,850 × 1,539;288キロバイト
-
 Bilance tep. čerpadla.jpg 686 × 506;71キロバイト
-
 Billan radiatif terrestre.svg 1,063 × 1,063;37キロバイト
-
 Birds Point-New Madrid Flow.jpg 2,000 × 1,363;274キロバイト
-
 Braddon by-election 2018 preference flow diagram.png 1,801 × 609;126キロバイト
-
 CARES Act Sankey Diagram.png 2,000 × 2,150;220キロバイト
-
 Charles Joseph Minard - Émigrants du Globe.jpg 5,972 × 4,444;26.19メガバイト
-
 CIS-A2K Strategy.png 3,507 × 2,480;1.63メガバイト
-
 Cjsflowco.svg 1,008 × 612;1.42メガバイト
-
 COD balance sewage treatment-DE.svg 709 × 309;17キロバイト
-
 Deforestation-emissions-in-trade-–-Sankey-01.png 1,493 × 1,714;207キロバイト
-

-
 Dojíždění.jpg 700 × 494;76キロバイト
-
 Drivhuseffekten.png 1,997 × 1,389;766キロバイト
-
 E-Flussbilder.jpg 1,501 × 990;313キロバイト
-
 Earth energy budget.svg 512 × 383;8キロバイト
-
 Earth heat balance Sankey diagram.svg 512 × 512;7キロバイト
-
 Earthenergybudgetgreenhouseeffect-no.svg 2,721 × 1,814;1.88メガバイト
-
 Earthenergybudgetgreenhouseeffect-onlypercentage-no.svg 2,721 × 1,814;1.88メガバイト
-
 Earthenergybudgetgreenhouseeffect-orignalvalues-no.svg 2,721 × 1,814;1.88メガバイト
-
 Efecto invernadero.PNG 750 × 577;20キロバイト
-
 Efectoinvernadoiro.svg 754 × 580;32キロバイト
-
 Efeito estufa.PNG 750 × 577;45キロバイト
-
 Efekt cieplarniany schemat 01.svg 750 × 577;20キロバイト
-
 Efekt cieplarniany schemat 02.png 2,344 × 1,803;292キロバイト
-
 Greenhouse Effect eu.png 1,628 × 1,212;43キロバイト
-
 Greenhouse Effect vn.png 750 × 577;62キロバイト
-
 Greenhouse Effect.png 750 × 577;28キロバイト
-
 Greenhouse Effect-fi.png 750 × 577;46キロバイト
-
 Effet de Serre.png 794 × 611;73キロバイト
-
 Effet de serre.svg 750 × 577;21キロバイト
-
 Effetto serra descrizione.svg 790 × 600;87キロバイト
-
 Efficiency diagram bg.svg 340 × 280;13キロバイト
-
 Efficiency diagram by Zureks-fr.svg 398 × 282;14キロバイト
-
 Efficiency diagram by Zureks.svg 340 × 280;13キロバイト
-
 Efficiency Diagram es.svg 340 × 280;13キロバイト
-
 Ene Flow Pow Plt uni.jpg 804 × 602;39キロバイト
-
 Ene Flow Pow Plt uni.png 660 × 487;8キロバイト
-
 Energifluskemo.svg 616 × 476;17キロバイト
-
 Energiflöden i atmosfären.jpg 1,910 × 1,249;514キロバイト
-
 Energiflöden i atmosfären.png 1,570 × 1,041;127キロバイト
-
 Energy flow US 2016.jpg 1,920 × 1,115;811キロバイト
-
 Energy Flow US 2016.png 3,249 × 1,887;510キロバイト
-
 Energy Flow US 2017.png 4,873 × 2,831;557キロバイト
-
 Energy Flow US 2019.png 3,249 × 1,911;525キロバイト
-
 F1 championship points sankey diagram.png 986 × 510;197キロバイト
-
 Globalni toky energie cs.svg 744 × 600;97キロバイト
-
 Greenhouse Effect (2017 NASA data)-it.svg 512 × 512;7キロバイト
-
 Greenhouse Effect (2017 NASA data).svg 960 × 960;7キロバイト
-
 Greenhouse Effect ar.svg 731 × 577;134キロバイト
-
 Greenhouse Effect as.svg 750 × 577;21キロバイト
-
 Greenhouse Effect el.svg 750 × 577;27キロバイト
-
 Greenhouse Effect eo.svg 750 × 577;73キロバイト
-
 Greenhouse Effect hu.svg 750 × 577;23キロバイト
-
 Greenhouse Effect id.png 750 × 577;59キロバイト
-
 Greenhouse Effect ja.png 750 × 577;22キロバイト
-
 Greenhouse Effect mk.svg 750 × 577;221キロバイト
-
 Greenhouse Effect nl.svg 826 × 633;21キロバイト
-
 Greenhouse Effect rev es.svg 771 × 619;15キロバイト
-
 Greenhouse Effect uk.svg 750 × 577;21キロバイト
-
 Greenhouse Effect zh-hans.svg 750 × 577;18キロバイト
-
 Greenhouse Effect-ca.svg 1,000 × 769;246キロバイト
-
 Greenhouse Effect-cs.svg 750 × 577;20キロバイト
-
 Greenhouse Effect-it.svg 800 × 615;22キロバイト
-
 Greenhouse Effect-mr.svg 750 × 577;27キロバイト
-
 Greenhouse Effect-no.svg 750 × 577;17キロバイト
-
 Greenhouse Effect-te.svg 750 × 577;21キロバイト
-
 Greenhouse effect.svg 500 × 500;2キロバイト
-
 Greenhouse Effect.svg 750 × 577;21キロバイト
-
 Greenhouse Effects-pa.svg 750 × 577;28キロバイト
-
 Ilustrační diagram tep. čerpadla.jpg 686 × 506;72キロバイト
-
 JIE Sankey V5 Fig1.png 2,183 × 2,319;172キロバイト
-
 Komala factions diagram.png 2,400 × 1,200;110キロバイト
-
 Landscape2015 MainSankey.png 3,508 × 2,480;563キロバイト
-
 Material Flow Accounting Scheme.png 757 × 381;20キロバイト
-
 Mississippi Project Design Flood.tif 1,502 × 1,127;727キロバイト
-
 Mississippi River flow.gif 774 × 1,000;48キロバイト
-
 Modelový Sankeyův diagram.jpg 800 × 469;62キロバイト
-
 Sankey diagram diesel.svg 500 × 560;19キロバイト
-

-
 Sankey diagram human circulatory system esp.png 2,000 × 4,000;323キロバイト
-
 Sankey diagram human circulatory system.svg 512 × 1,024;6キロバイト
-
 Sankey diagram of 2021 West Bengal elections.png 640 × 640;96キロバイト
-
 Sankey Diagram of Linux Kernel Source Lines of Code.jpg 2,093 × 3,072;955キロバイト
-
 Sankey Diagram of US Consumer Expenditure in 2012.jpg 1,449 × 1,353;378キロバイト
-

-
 Sankey KClO3.svg 789 × 1,318;117キロバイト
-
 Sankey Uppsala Kommun slutleverans 191125.png 1,070 × 805;100キロバイト
-
 Sankeydiagramm für einen 2-T-Schiffsdiesel.jpg 625 × 571;34キロバイト
-
 SankeyICRC2020.png 1,200 × 1,200;135キロバイト
-
 Sankeymatic 600x600.png 600 × 600;53キロバイト
-
 Sankeysteam.png 2,151 × 1,359;68キロバイト
-
 SankeyUmicarMax.pdf 1,754 × 1,239;33キロバイト
-
 Sankeyverbeterd.pdf 1,754 × 1,239;31キロバイト
-
 Schemat sprawności by Zureks.svg 340 × 280;13キロバイト
-
 Sun climate polish.svg 612 × 792;41キロバイト
-
 Sun climate polish2.png 1,275 × 1,650;160キロバイト
-
 Sun climate polish3.png 1,275 × 978;113キロバイト
-
 Sun climate polish3.svg 744 × 600;224キロバイト
-
 Sun climate system alternative (German) 2008.svg 744 × 600;97キロバイト
-
 Sun climate system alternative (German).svg 744 × 600;103キロバイト
-
 Sun climate system alternative (rumantsch).jpg 744 × 600;127キロバイト
-
 Sun climate system alternative (Spanish) 2008.svg 744 × 600;676キロバイト
-
 Symbolic Tree of Costs in Arsenal, 1885.jpg 873 × 1,445;196キロバイト
-
 Så fungerar växthuseffekten.png 970 × 667;70キロバイト
-
 The green house effect CAT.svg 1,240 × 871;33キロバイト
-
 The green house effect.svg 1,198 × 834;692キロバイト
-

-
 USEnFlow02-quads.gif 700 × 560;48キロバイト
-
 WikipediaTranslationAssistant translation-directions 22-07.png 1,316 × 1,299;285キロバイト
-
 WMF Board 2021 election results.svg 6,000 × 3,000;191キロバイト
-
 WMF Board 2022 election results.svg 1,200 × 600;20キロバイト
-
 Yakhchal radiative cooling.svg 512 × 526;5キロバイト
-
 Účinnost-diagram.jpg 829 × 471;66キロバイト


.png)


-it.svg)
.svg)


_2008.svg)
.svg)
.jpg)
_2008.svg)


