Category:Sea level rise
Salti al navigilo
Salti al serĉilo
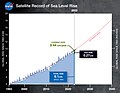
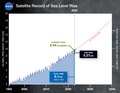
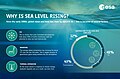
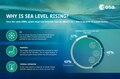
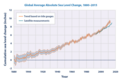
current long-term trend for global sea levels to rise mainly in response to climate change     | |||||
| Alŝuti plurmedion | |||||
| Prononco-registraĵo | |||||
|---|---|---|---|---|---|
| Estas | |||||
| Subaro de | |||||
| Rilatas al | |||||
| |||||
Subkategorioj
Ĉi tiu kategorio havas la 2 jenajn subkategoriojn, el 2 entute.
T
Dosieroj en kategorio “Sea level rise”
La jenaj 125 dosieroj estas en ĉi tiu kategorio, el 125 entute.
-
De-Meeresspiegelanstieg.ogg 3,2 s; 30 KB
-
 1880- Global average sea level rise (SLR) - annually.svg 1 200 × 675; 6 KB
-
 1900-2300 Long-term projections of sea level rise.svg 1 200 × 675; 5 KB
-
 1950- High tide flooding, by year - NOAA tide gauges (U.S.).svg 900 × 675; 3 KB
-
 1991 IPCC sea level rise estimate and observation.png 800 × 500; 19 KB
-

-
 2015-2100 Impacts of global warming on glaciers and sea level rise.svg 1 200 × 800; 3 KB
-
 20190708 Stripe graphic of sea level change (1880-2013) Richard Selwyn Jones.png 3 200 × 1 800; 56 KB
-
 20210125 The Cryosphere - Floating and grounded ice - imbalance - climate change.png 1 889 × 1 288; 61 KB
-
 2050 Projected sea level rise - United States coasts - NOAA.svg 900 × 600; 2 KB
-
 30 Years of Sea Level Rise (PIA25775).jpg 3 300 × 2 550; 436 KB
-
 30 Years of Sea Level Rise (PIA25775).tif 3 300 × 2 550; 5,15 MB
-

-
 6m Sea Level Rise.jpg 2 048 × 1 024; 248 KB
-
 Alt gmsl seas not rem.svg 800 × 540; 59 KB
-

-

-
 Beach erosion (8427148836).jpg 3 504 × 2 336; 721 KB
-
 Causes of sea-level rise ESA22223363.jpg 1 772 × 1 169; 990 KB
-
 Causes of sea-level rise ESA22223363.tiff 2 480 × 1 637; 19,41 MB
-
 Change in Antarctic ice shelf barrier position and thickness over time.png 2 067 × 1 069; 267 KB
-
 ClimateDashboard-global-sea-levels-graph-20230329-1400px.png 1 400 × 1 200; 88 KB
-
 Cumulative mass change for glacier regions between 1962 and 2019.png 1 118 × 1 531; 343 KB
-
 EarthMinute- Sea Level Rise - rectangle v2 (20902684106).jpg 1 200 × 602; 427 KB
-
 EarthMinute- Sea Level Rise - square (20928938565).jpg 1 200 × 1 200; 472 KB
-
 Ecological ratchet model of marsh migration in a forest.jpg 510 × 492; 364 KB
-

-
 Evolution-of-GMSL-time-series-from-six-different-groups’.jpg 940 × 639; 68 KB
-
 Gemiddelde zeestand in Nederland.jpg 926 × 344; 62 KB
-
 Glaciers and Sea Level Rise (8741348179).jpg 1 000 × 666; 189 KB
-

-

-
Global Mean Sea Level 1993-2023 (SVS5221 - seaLevel Curves 2024 Spanish).webm 20 s, 3 840 × 2 160; 46,63 MB
-

-
Global Mean Sea Level 1993-2023 (SVS5221 - seaLevel Curves vert 2024 English 1920p30).webm 20 s, 1 080 × 1 920; 15,39 MB
-

-
Global Mean Sea Level 1993-2023 (SVS5221 - seaLevel Curves vert 2024 Spanish 1920p30).webm 20 s, 1 080 × 1 920; 15,26 MB
-

-
Global Mean Sea Level 1993-2023 (SVS5221 - seaLevelRise 2024 English).webm 20 s, 3 840 × 2 160; 46,77 MB
-
 Global sea level rise from 1992 to 2020, satellite data chart.svg 800 × 540; 59 KB
-
 Global sea level rise projections 2000-2100.png 1 066 × 692; 11 KB
-
 Greenland contrib SLR.png 1 258 × 1 716; 251 KB
-
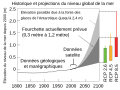 Historique et projections du niveau de la mer.svg 960 × 720; 9 KB
-
 Ice-melting hg.gif 1 080 × 608; 60,33 MB
-
Ice-melting hg.ogg 27 s, 1 920 × 1 080; 2,96 MB
-
 Ice-melting sealevel-rise1 hg.jpg 1 920 × 1 080; 117 KB
-
 Ice-melting sealevel-rise2 hg.jpg 1 920 × 1 080; 251 KB
-
 Ice-melting sealevel-rise3 hg.jpg 1 920 × 1 080; 282 KB
-
 Ice-melting sealevel-rise4 hg.jpg 1 920 × 1 080; 289 KB
-
 Ice.melting sea-level-rise hg.jpg 7 680 × 1 080; 489 KB
-
 Interactions between sea-level rise and wave exposure on reef island dynamics in the Solomon Islands.pdf 1 239 × 1 752, 9 paĝoj; 1,45 MB
-
 Kopp 2023 4 contributions.png 2 067 × 1 624; 396 KB
-
 Like the sea level, we rise, Berlin 08.02.2019 (cropped).jpg 994 × 1 405; 622 KB
-
 Macrotidal versus microtidal sea level rise relocation of mangroves.webp 746 × 659; 104 KB
-
 Major cities threatened by sea level rise.png 1 425 × 625; 29 KB
-
 Mass balance atmospheric circulation.png 700 × 423; 187 KB
-
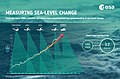 Measuring sea-level change ESA22185240.jpg 17 362 × 11 457; 6,71 MB
-
 Melted Ice - Western Hemisphere - Current Seacoast Outlines (9558685246).jpg 1 548 × 951; 272 KB
-
 Melting in Greenland in 2010.jpg 720 × 1 001; 143 KB
-
 NASA-Satellite-sea-level-rise-observations.jpg 1 000 × 813; 113 KB
-
 NCA- Sea Level Rise (14312810890).jpg 1 024 × 830; 760 KB
-
 Next week NASA goes in deep about Earth’s rising seas (20550750810).jpg 640 × 640; 105 KB
-
 NOAA sea level trend 1993 2010.png 2 425 × 1 337; 1,5 MB
-
 Oceans are rising.jpg 6 016 × 4 000; 5,22 MB
-
 Pattern and causes of marsh expansion into a forest.jpg 1 084 × 804; 392 KB
-
 People's Climate March 2017 20170429 4270 (34220546951).jpg 2 218 × 2 218; 1,89 MB
-
 Postglacial Sea level Rise Curve and Meltwater Pulses (MWP).jpg 783 × 800; 74 KB
-

-
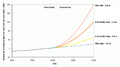
 Projections of global mean sea level rise by Parris et al. (2012) NO.png 1 355 × 761; 95 KB
-
 Projections of global mean sea level rise by Parris et al. (2012)-es.png 1 355 × 761; 53 KB
-
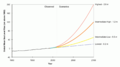 Projections of global mean sea level rise by Parris et al. (2012).png 1 355 × 761; 34 KB
-
 Proposed conceptual model of ecological ratchet.jpg 546 × 999; 208 KB
-
 Recent Sea Level Rise fr.png 800 × 616; 85 KB
-
 Recent Sea Level Rise German.png 537 × 373; 44 KB
-
 Recent Sea Level Rise-fi.png 800 × 561; 111 KB
-
 Recent Sea Level Rise-fr.svg 537 × 373; 54 KB
-
 Recent Sea Level Rise-template.png 800 × 561; 103 KB
-
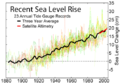 Recent Sea Level Rise.png 537 × 373; 47 KB
-
 Responses to Sea Level Rise.svg 1 200 × 500; 25 KB
-
 S41467-019-11755-z.pdf 1 239 × 1 629, 9 paĝoj; 2,24 MB
-
 S41467-019-12808-z.pdf 1 239 × 1 629, 12 paĝoj; 2,78 MB
-
 Satellite sea level observations 1993-2018.png 590 × 300; 35 KB
-

-
 Save our ocean, People's Climate March, 29 April 2017 (cropped).jpg 1 568 × 2 218; 1,03 MB
-
 Scholia topic profile for sea level rise (Q841083) as of 2022-09-24.png 1 920 × 16 439; 4,39 MB
-
 Screenshot of the Scholia profile for sea level rise as of 2022-09-24.png 1 126 × 973; 323 KB
-
 Sea Level Change 1880 to 2015.png 928 × 615; 83 KB
-
 Sea level change 1993 to 2018.jpg 2 000 × 1 258; 542 KB
-
 Sea level change and diversification of Tyrannosauroidea.png 3 390 × 4 031; 1,93 MB
-
 Sea Level Clock -1 - Rauschenberg Residency.jpg 1 915 × 1 265; 795 KB
-
 Sea level history and projections-cs.svg 512 × 384; 13 KB
-
 Sea level history and projections-da.svg 960 × 720; 5 KB
-
 Sea level history and projections-fr.svg 960 × 720; 5 KB
-
 Sea level history and projections-vi.svg 960 × 720; 16 KB
-
 Sea level history and projections.svg 960 × 720; 7 KB
-
 Sea level rise projections for the 21st century.png 827 × 874; 17 KB
-
 Sea Level Rise.png 1 080 × 810; 140 KB
-

-
Sea Level Through a Porthole (2023) (SVS5235 - seaLevelWaveTank noWW 3-5-2024a wavetank).webm 50 s, 2 160 × 2 160; 71,8 MB
-

-
Sea Level Through a Porthole (2023) (SVS5235 - seaLevelWaveTankComp noWW 3-5-5-2024a 2160p30).webm 50 s, 2 160 × 2 160; 72,33 MB
-
Sea Level Through a Porthole (2023) for Science-on-a-Sphere (SVS5304).webm 50 s, 2 048 × 1 024; 15,14 MB
-
Sea surface height change from 1992 to 2019.webm 25 s, 3 840 × 2 160; 22,76 MB
-
 Sea-level rise is not the same everywhere ESA22245027.jpg 5 788 × 3 819; 1,19 MB
-
 Sea-level-rise scheme.svg 842 × 595; 131 KB
-
 Sealevel.png 633 × 467; 5 KB
-
-
Slow Reveal Graphs- Global Mean Sea Level 1993-2023 (SVS5312 - seaLevelRise Slow 1).webm 14 s, 1 920 × 1 080; 8,34 MB
-

-
Slow Reveal Graphs- Global Mean Sea Level 1993-2023 (SVS5312 - seaLevelRise Slow 2).webm 14 s, 1 920 × 1 080; 9,04 MB
-

-
Slow Reveal Graphs- Global Mean Sea Level 1993-2023 (SVS5312 - seaLevelRise Slow 3).webm 14 s, 1 920 × 1 080; 9,09 MB
-

-
Slow Reveal Graphs- Global Mean Sea Level 1993-2023 (SVS5312 - seaLevelRise Slow 4).webm 14 s, 1 920 × 1 080; 9,69 MB
-

-
Slow Reveal Graphs- Global Mean Sea Level 1993-2023 (SVS5312 - seaLevelRise Slow 5).webm 20 s, 3 840 × 2 160; 31,64 MB
-
 Slow Reveal Graphs- Global Mean Sea Level 1993-2023 (SVS5312).png 1 920 × 1 080; 553 KB
-
 Spatial variability in the time of emergence of modern rates of relative sea level.webp 2 001 × 2 371; 246 KB
-
 Spatiotemporal model decomposition for New Jersey, Florida, and Scotland.webp 1 000 × 1 520; 98 KB
-
 The Rising Sea Level.jpg 1 150 × 750; 122 KB
-
 Time of emergence of global sea-level rise.webp 1 750 × 529; 67 KB
-
 Trends in global average absolute sea level, 1870-2008 (US EPA).png 670 × 717; 61 KB
-
WATER- Moet jij straks op de eerste verdieping gaan wonen om droge voeten te houden-.webm 15 min 4 s, 1 920 × 1 080; 163 MB
-
WATER- Waarom stijgt de zeespiegel als je een watermeloen eet-.webm 15 min 47 s, 1 920 × 1 080; 180,77 MB
-
 Zeespiegelstijging 1993-nu.png 918 × 755; 104 KB
_-_annually.svg)

.svg)


_Richard_Selwyn_Jones.png)


.jpg)
.jpg)


_of_the_different_global_ice_components,_total_floating_ice,_total_grounded_ice_and_global_total_per_decade_and_over_the_common_period_1994%E2%80%932017.png)
_Southern_Hemisphere_and_(b)_Northern_Hemisphere.png)
.jpg)


.jpg)
.jpg)


.jpg)
_and_grounded_(purples)_components.png)
.jpg)
.jpg)
.jpg)
.jpg)


.jpg)


.jpg)


.jpg)
.jpg)


.jpg)
.jpg)
.png)
_NO.png)
-es.png)
.png)


.gif)
.jpg)


_(SVS5235_-_seaLevelWaveTank_noWW_3-5-2024a_wavetank_01500_print).jpg)
_(SVS5235_-_seaLevelWaveTankComp_noWW_3-5-5-2024a_01500_print).jpg)


.jpg)
.jpg)
.jpg)
.jpg)
.jpg)
.png)


.png)

_as_of_2022-09-24.png)