Category:Stock market indexes
Pereiti į navigaciją
Jump to search
| Category Stock market indexes on sister projects: | |||||||||
|---|---|---|---|---|---|---|---|---|---|
Wikinews | |||||||||
measures a stock market to help investors compare stock prices  | |||||
| Įkelti mediją | |||||
| Poklasis |
| ||||
|---|---|---|---|---|---|
| Skiriasi nuo | |||||
| |||||
Subkategorijos
Rodomos 23 subkategorijos (iš viso yra 23 subkategorijos).
2
- 2020 stock market crash (7 F)
A
- Amsterdam Exchange index (11 F)
C
D
H
- Hang Seng Index (5 F)
M
- Market Data Index on 20050726 (36 F)
- MSCI World (7 F)
N
- Nasdaq Composite (4 F)
- NASDAQ-100 (2 F)
S
V
- VIX (finance) (5 F)
Daugialypės terpės rinkmenos kategorijoje „Stock market indexes“
Rodomi 92 šios kategorijos rinkmenos (iš viso kategorijoje yra 92 rinkmenos).
-
 10-Year Price Trend of Dow Jones Global Titans 50 Index (USD).svg 600 × 371; 1,1 MiB
-
 2022 Dow Jones Industrial Average and S&P 500.png 1 318 × 466; 77 KiB
-
 Aktienindex des Statistischen Reichsamtes in Goldmark.png 3 508 × 2 480; 57 KiB
-
 Aktienindex des Statistischen Reichsamtes in Papiermark.png 3 508 × 2 480; 51 KiB
-
 Aktienindex des Statistischen Reichsamtes in Reichsmark.png 3 508 × 2 480; 58 KiB
-
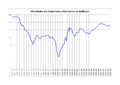
 Aktienindex Merval 01 01 1998 bis 05 10 2004.png 900 × 560; 17 KiB
-
 Aktienindex1840ff.PNG 968 × 602; 18 KiB
-
 All Ordinaries.png 3 508 × 2 480; 48 KiB
-
 AscX-Index.png 398 × 160; 4 KiB
-
 ASX200.png 616 × 393; 12 KiB
-
 Athex Composite Share Price Index.png 3 508 × 2 480; 50 KiB
-
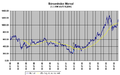
 Austrian stock market index.jpg 900 × 651; 124 KiB
-
 Austrian Traded Index.png 874 × 467; 27 KiB
-
 BCPP 2007 2008.png 370 × 170; 3 KiB
-
 BEL 20.svg 576 × 432; 129 KiB
-
 BEL20 index.png 1 102 × 734; 58 KiB
-
 BEL20.png 3 508 × 2 480; 53 KiB
-
 BIRS Index Performance Graph (May 04-Sep 06).jpg 1 259 × 604; 79 KiB
-
 Ibovespa.png 636 × 561; 8 KiB
-
 BSE Sensex.png 3 508 × 2 480; 53 KiB
-
 Comparison of three stock indices after 1975.svg 800 × 400; 33 KiB
-
 Dow Jones Transportation Average.png 3 508 × 2 480; 45 KiB
-
 Dow Jones Utility Average.png 3 508 × 2 480; 55 KiB
-
 Euro Münzgeld und Portmonee mit grünem Pfeil (Geld, Kleingeld, Münzen).jpg 3 655 × 2 437; 1,73 MiB
-
 Euro Münzgeld und Portmonee mit rotem Pfeil (Geld, Kleingeld, Münzen).jpg 3 655 × 2 437; 1,72 MiB
-
 Euro Münzgeld und Portmonee mit rotem Pfeil - Radial - (Geld, Kleingeld, Münzen).jpg 3 655 × 2 437; 2,4 MiB
-
 EURO STOXX 50.png 3 508 × 2 480; 54 KiB
-
 European Stock Market concept image.jpg 4 000 × 2 667; 2,1 MiB
-
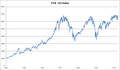 FTSE 100 index chart since 1984.png 992 × 578; 23 KiB
-
 FTSE MIB.png 3 508 × 2 480; 54 KiB
-
 Hang Seng Index.png 3 508 × 2 480; 54 KiB
-

-
 IDX Composite.png 3 508 × 2 480; 56 KiB
-
 IE Real SandP Prices, Earnings, and Dividends 1871-2006 - PT.png 1 024 × 608; 157 KiB
-
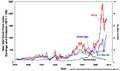 IE Real SandP Prices, Earnings, and Dividends 1871-2006.png 1 081 × 642; 60 KiB
-
 ISE-100 Index.png 3 508 × 2 480; 55 KiB
-
 ISE-100 Index.svg 900 × 630; 203 KiB
-
 ISEQ Overall Index.png 3 508 × 2 480; 56 KiB
-
 Kospi-index-monthly (1993-2017).png 817 × 516; 24 KiB
-
 Kospi.png 780 × 357; 8 KiB
-
 KOSPI.png 3 508 × 2 480; 52 KiB
-
 Légende du calcul.jpg 320 × 43; 3 KiB
-
 Mbi.jpg 170 × 69; 3 KiB
-
 Merval részvényindex 1998 01 01 2004 10 5.png 900 × 560; 28 KiB
-
 MERVAL.png 3 508 × 2 480; 55 KiB
-
 MICEX Index graph.png 2 679 × 2 388; 174 KiB
-
 Micex.png 342 × 342; 3 KiB
-
 MOEX Russia Index.png 981 × 644; 29 KiB
-
 MSCI EM (2020).svg 3 899 × 2 601; 28 KiB
-
 NASDAQ 100 - Closing Prices from 1985 - 2024.png 3 146 × 2 052; 81 KiB
-
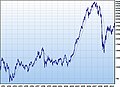
 NASDAQ IXIC - dot-com bubble small.png 477 × 286; 4 KiB
-
 NASDAQ-100.png 3 508 × 2 480; 54 KiB
-
 NYSE Arca Gold BUGS Index.png 3 508 × 2 480; 53 KiB
-
 NZSX50.png 3 508 × 2 480; 49 KiB
-
 OBX Index.png 3 508 × 2 480; 51 KiB
-
 OMX Copenhagen 20.png 3 508 × 2 480; 53 KiB
-
 OMX Helsinki 25.png 3 508 × 2 480; 55 KiB
-
 OMX Iceland 15 SEP-OCT 2008.png 1 080 × 534; 33 KiB
-
 OMX Stockholm 30.png 3 508 × 2 480; 54 KiB
-
 OMXI15.jpg 899 × 652; 78 KiB
-
 OUTPRFRM Stock Score to make the right trade.jpg 1 130 × 900; 133 KiB
-
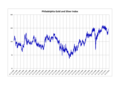 Philadelphia Gold and Silver Index.png 3 508 × 2 480; 54 KiB
-
 PSI 20.png 3 508 × 2 480; 54 KiB
-
 PSI-20 performance.png 3 083 × 1 604; 280 KiB
-
 Russell 2000.png 3 508 × 2 480; 50 KiB
-
 S&P BSE SENSEX Chart.png 1 029 × 468; 34 KiB
-
 S&P BSE SENSEX chart.svg 737 × 382; 182 KiB
-
 S&P TSX Composite Index.png 3 508 × 2 480; 54 KiB
-
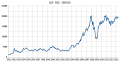
 S&P500 (1950-12).jpg 898 × 554; 129 KiB
-
 SandP 500 Historical Graph.svg 800 × 400; 318 KiB
-
 SET Index.png 3 508 × 2 480; 50 KiB
-
 Shanghai Composite Index.webp 5 242 × 1 413; 115 KiB
-
 SSE Composite Index.png 2 002 × 1 136; 79 KiB
-
 Stock market trading.jpg 1 024 × 1 024; 97 KiB
-
 STOXX Europe 50.png 3 508 × 2 480; 54 KiB
-
 STOXX Europe 600.png 1 254 × 741; 65 KiB
-
 Straits Times Index.png 1 196 × 669; 38 KiB
-
 Tadawul All Share Index (TASI) Since 1.png 2 006 × 1 264; 29 KiB
-
 TEPIX (Cro).PNG 800 × 600; 125 KiB
-
 TEPIX.PNG 2 048 × 1 536; 566 KiB
-
 Tokyo Stock Price Index - (TOPIX).webp 4 387 × 1 395; 99 KiB
-
 Trading apps on an iPhone screen.jpg 4 000 × 2 667; 573 KiB
-
 UK Stock Market - Investing in the United Kingdom.jpg 4 000 × 2 667; 2,02 MiB
-
 Ukranian PFTS Stock index 2001-2016.png 1 849 × 807; 21 KiB
-
 US Stock Market - Investing in the United States.jpg 4 000 × 2 667; 1,98 MiB
-
Wie funktionieren ETFs? Gut zu wissen - Tagesschau.webm 59 s, 1 280 × 720; 3,92 MiB
-
 WIG20.png 3 508 × 2 480; 54 KiB
-
 Wilshire 5000 historical graph.svg 800 × 400; 44 KiB
-
 Wilshire 5000 historical.png 1 291 × 575; 36 KiB
-
 Wilshire 5000 Index.webp 3 770 × 1 811; 94 KiB
-
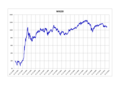
 Wilshire 5000 price index 31 Dec 1970 - 03 Jan 2019.png 1 391 × 720; 30 KiB
-
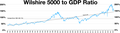 Wilshire 5000 to GDP ratio.webp 4 753 × 1 324; 154 KiB
.svg)


.jpg)


.jpg)
.jpg)
.jpg)


.png)


.svg)


.jpg)


_Since_1.png)
.PNG)


.webp)