Category:Subduction diagrams
Aller à la navigation
Aller à la recherche
Sous-catégories
Cette catégorie comprend 4 sous-catégories, dont les 4 ci-dessous.
Média dans la catégorie « Subduction diagrams »
Cette catégorie comprend 198 fichiers, dont les 198 ci-dessous.
-
 Accreted Terrane Model.gif 594 × 201 ; 58 kio
-
 Accretion-Subduction.PNG 751 × 388 ; 67 kio
-
 Accretionary Event.jpg 438 × 540 ; 221 kio
-
 Accretionary event1.jpg 438 × 540 ; 222 kio
-
 Accretionary wedge.png 1 158 × 794 ; 805 kio
-
 AccreWedge.jpg 779 × 960 ; 415 kio
-
 Akrezio-prisma irudia.png 264 × 167 ; 12 kio
-
 Analogue Modelling of a Subduction Zone.gif 1 581 × 632 ; 150 kio
-
 Analogue Modelling of the Growth and erosion of an orogenic wedge.gif 1 825 × 547 ; 352 kio
-
 Asperity model - 4categories.png 1 800 × 1 600 ; 63 kio
-
 Basal.jpg 1 810 × 864 ; 201 kio
-
 Block rotation.png 1 334 × 876 ; 81 kio
-
 Block rotation2.png 1 290 × 878 ; 81 kio
-
 Boundary conditions applied to models.tif 2 164 × 1 013 ; 227 kio
-
 Carbonate-Silicate Cycle (Carbon Cycle focus).jpg 550 × 405 ; 232 kio
-
 Chimenea kimberlita.svg 1 052 × 744 ; 757 kio
-
 Collision.PNG 453 × 518 ; 10 kio
-
 Combined subduction gif.gif 1 600 × 666 ; 524 kio
-
 Compression-coupe.jpg 500 × 164 ; 91 kio
-
 Compression.jpg 500 × 243 ; 89 kio
-
 Compressional decollement.pdf 1 650 × 1 275 ; 253 kio
-
 Compressional decollement.svg 1 200 × 660 ; 22 kio
-
 Compressional Setting.pdf 1 500 × 1 125 ; 56 kio
-
 Compressional Setting.svg 1 200 × 562 ; 71 kio
-
 Continental-continental con-uk.png 301 × 157 ; 31 kio
-
 Continental-continental convergence cs.svg 307 × 162 ; 38 kio
-
 Continental-continental convergence de.svg 307 × 162 ; 52 kio
-
 Continental-continental convergence en.svg 307 × 162 ; 55 kio
-
 Continental-continental convergence Fig21contcont i18.png 298 × 156 ; 12 kio
-
 Continental-continental convergence Fig21contcont SK.gif 836 × 480 ; 41 kio
-
 Continental-continental convergence Fig21contcont-ar.gif 301 × 173 ; 17 kio
-
 Continental-continental convergence Fig21contcont.gif 301 × 173 ; 15 kio
-
 Continental-continental destructive plate boundary.svg 2 512 × 1 537 ; 2 kio
-
 Continentecontinete1.jpg 2 573 × 724 ; 2,05 Mio
-
 Conventional Plate tectonics vs DDS.svg 568 × 578 ; 26 kio
-
-
 Curved fault.png 1 730 × 946 ; 49 kio
-
 Curved fault3.png 2 146 × 1 236 ; 162 kio
-
 Cycle orogénique.png 1 790 × 2 490 ; 615 kio
-
 Decollement in a compressional setting He.jpg 1 280 × 582 ; 102 kio
-
 Decollement in a compressional setting.pdf 1 650 × 1 275 ; 254 kio
-
 Decollement in a compressional setting.svg 1 200 × 660 ; 28 kio
-
 Deformation gif.gif 1 052 × 590 ; 81 kio
-
 Deformational features.png 855 × 455 ; 37 kio
-
 Deformational features2.png 1 842 × 1 076 ; 92 kio
-
 Doubly Convergence.gif 1 522 × 1 076 ; 207 kio
-
 Down to down NEW.jpg 273 × 247 ; 18 kio
-
 Down to down NEW.svg 302 × 239 ; 20 kio
-
 Eclogitization schematic 1.png 1 280 × 1 024 ; 70 kio
-
 Eclogitization Schematic.png 1 280 × 1 024 ; 71 kio
-
 ED1 updated.jpg 12 479 × 4 683 ; 2,72 Mio
-
 Ev map.png 1 712 × 368 ; 321 kio
-
 Ev map2.png 2 178 × 644 ; 332 kio
-
 Evo diagram of oblique subduction.jpg 2 844 × 1 038 ; 335 kio
-
 Evo map of oblique subduction 2.jpg 3 913 × 784 ; 396 kio
-
 Evo map of oblique subduction.jpg 3 913 × 784 ; 393 kio
-
 Evolutionary Diagram.png 346 × 491 ; 36 kio
-
 Fault + Sliver.png 1 308 × 1 156 ; 88 kio
-
 Fault earthquake.png 2 146 × 1 202 ; 166 kio
-
 Fault in slab.png 2 190 × 1 174 ; 141 kio
-
 Forearc sliver.png 1 802 × 1 052 ; 72 kio
-
 Fosa.jpg 727 × 458 ; 181 kio
-
 Front and rear oblique subduction.png 981 × 579 ; 28 kio
-
 Front and rear oblique subduction1.png 964 × 568 ; 25 kio
-
 Front and rear oblique subduction2.png 1 033 × 616 ; 35 kio
-
 Front and rear oblique subduction3.png 953 × 620 ; 35 kio
-
 Front and rear oblique subduction4.png 1 006 × 610 ; 36 kio
-
 Geodynamisch schema met continentale collisie.png 660 × 318 ; 135 kio
-
 Geology of Kimberley (Western Australia) Tectonic Evolution (a).png 1 866 × 999 ; 336 kio
-
 Geology of Kimberley (Western Australia) Tectonic Evolution (b).png 1 866 × 999 ; 451 kio
-
 Geology of Kimberley (Western Australia) Tectonic Evolution (c).png 1 866 × 1 001 ; 386 kio
-
 Geology of Kimberley (Western Australia) Tectonic Evolution (d).png 1 866 × 1 001 ; 441 kio
-
 Geology of Kimberley (Western Australia) Tectonic Evolution (e).png 1 866 × 1 001 ; 362 kio
-
 Gif deformation.gif 881 × 491 ; 63 kio
-
 Gif deformation2.gif 1 762 × 982 ; 156 kio
-
 Gif deformation3s.gif 970 × 691 ; 135 kio
-
 HeimefrontModell.jpg 1 029 × 877 ; 358 kio
-
 Horizontal view of oblique subduction.png 1 132 × 842 ; 23 kio
-
 Hot subduction.png 352 × 268 ; 57 kio
-
 India-Eurasia collision.gif 480 × 360 ; 4,88 Mio
-
 Induced Initiation.png 1 560 × 1 837 ; 110 kio
-
 IntraoceanicIslandModel.jpg 2 468 × 2 113 ; 493 kio
-
 Island arc.svg 1 404 × 2 219 ; 61 kio
-
 Limiteconvergente-continenteycontinente.png 301 × 173 ; 17 kio
-
 Lithoshperic break-up.gif 1 522 × 1 076 ; 134 kio
-
 Lithospheric break up 2.gif 1 500 × 1 060 ; 141 kio
-
 Lithospheric break up...gif 1 500 × 1 060 ; 141 kio
-
 Lithospheric break up.gif 1 500 × 1 060 ; 146 kio
-
 Lithospheric break-up model setup.svg 842 × 595 ; 18 kio
-
 Lithospheric break-up-01.jpg 3 508 × 2 480 ; 976 kio
-
 Long term couple.png 704 × 526 ; 33 kio
-
 Long term deformation.png 1 848 × 1 138 ; 114 kio
-
 Long term deformation2.png 1 524 × 1 134 ; 114 kio
-
 Límit convergent entre continents.png 301 × 173 ; 8 kio
-
 Mantle flow gradient.png 2 040 × 1 232 ; 117 kio
-
 Mantle flow gradient2.png 1 528 × 878 ; 117 kio
-
 Mega splay fault 23.png 2 070 × 1 484 ; 685 kio
-
 Motion long.png 2 172 × 1 166 ; 177 kio
-
 Motion short.png 2 162 × 1 222 ; 157 kio
-
 Métamorphisme subduction.svg 741 × 620 ; 1,05 Mio
-
 Oblique angle.png 2 130 × 1 052 ; 146 kio
-
 Oblique angle4.png 2 118 × 1 324 ; 146 kio
-
 Oblique setting.png 1 802 × 760 ; 110 kio
-
 Oblique setting2.png 1 804 × 792 ; 106 kio
-
 Oblique subduction + features.png 1 758 × 916 ; 95 kio
-
 Oblique subduction 3.gif 800 × 504 ; 181 kio
-
 Oblique subduction gif.gif 800 × 666 ; 247 kio
-
 Oblique subduction long term deformation.png 1 400 × 960 ; 69 kio
-
 Oblique Subduction Model.png 1 630 × 1 090 ; 73 kio
-
 Oblique subduction short term deformation.png 1 492 × 976 ; 66 kio
-
 Oblique subduction.gif 600 × 380 ; 228 kio
-
 Oblique subduction3.gif 800 × 504 ; 181 kio
-
 Oblique subdution vectors.png 2 138 × 1 044 ; 147 kio
-
 Ophiolite Formation.pdf 1 127 × 764 ; 207 kio
-
 Orogenic wedge.jpg 580 × 213 ; 53 kio
-
 Permanent deformation.png 1 940 × 1 074 ; 138 kio
-
 PIA18428.tif 4 519 × 2 810 ; 36,35 Mio
-
 Plate accretion stages through time.pdf 1 275 × 1 650 ; 357 kio
-
 Plate boundaries.png 1 134 × 700 ; 69 kio
-
 Plate Tectonics vs DDS.svg 301 × 311 ; 25 kio
-
 Plate Tectonics vs Divergent Double Subduction.svg 568 × 578 ; 26 kio
-
 Plumeinducedsubduction.png 2 163 × 2 029 ; 281 kio
-
 Polodial flow.png 2 060 × 1 438 ; 153 kio
-
 Prisma de acrecion lmb rg.jpg 264 × 167 ; 45 kio
-
 Prisma de acrecion lmb.png 264 × 167 ; 9 kio
-
 Progressive tearing model.gif 1 500 × 1 060 ; 248 kio
-
 Retroarc Foreland Basin.png 399 × 257 ; 33 kio
-
 Schemetic diagram for DZ tectonic settings.png 829 × 540 ; 38 kio
-
 Sediment transport 2.png 1 069 × 746 ; 176 kio
-
 Sediment transport 3d.png 2 036 × 1 412 ; 176 kio
-
 Sediment transport2.png 2 076 × 1 406 ; 176 kio
-
 Seismic profile of a plate boundary fault.png 1 068 × 328 ; 677 kio
-
 Shear Partitioning Mechanism.png 3 165 × 2 482 ; 203 kio
-
 Shear zone.png 1 316 × 1 122 ; 86 kio
-
 Short term coupling.png 788 × 524 ; 31 kio
-
 Short term deformation.png 1 490 × 964 ; 101 kio
-
 Short term deformation2.png 1 928 × 1 174 ; 108 kio
-
 Short term deformation3.png 1 604 × 1 160 ; 108 kio
-
 Short term deformation9.png 1 966 × 1 082 ; 123 kio
-
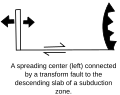
 Simple Subduction Zone with MOR.jpg 640 × 480 ; 15 kio
-
 Simplified convergent boundaries.jpg 2 122 × 3 092 ; 1,98 Mio
-
 Slab break model.gif 1 500 × 1 060 ; 93 kio
-
 Slab break.gif 1 500 × 1 060 ; 101 kio
-
 Slab detachment.png 3 469 × 3 201 ; 516 kio
-
 Slab rollback.png 2 064 × 1 296 ; 125 kio
-
 Slab rollback2.png 2 062 × 1 350 ; 141 kio
-
 Slab window cross-section.png 1 984 × 1 459 ; 636 kio
-
 Splay fault.png 1 818 × 1 152 ; 688 kio
-
 Splay fault5.png 1 778 × 1 133 ; 687 kio
-
 Spontaneous induced.png 1 225 × 1 489 ; 80 kio
-
 Spreading centers constant zh-tw.png 4 000 × 3 200 ; 268 kio
-
 Spreading to Down NEW.jpg 302 × 239 ; 21 kio
-
 Spreading to Down NEW.svg 302 × 239 ; 21 kio
-
 Spreading to upper NEW.jpg 310 × 248 ; 21 kio
-
 Spreading to upper NEW.svg 310 × 248 ; 10 kio
-
 Spreading to upper zh-tw.png 4 000 × 3 200 ; 286 kio
-
 Stage 1.svg 636 × 310 ; 392 kio
-
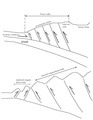 Structure of accretionary prism and land or seaward thrust folds.pdf 1 275 × 1 650 ; 252 kio
-
 Subduction animation.gif 800 × 527 ; 168 kio
-
 Subduction boundary and asperity.png 1 150 × 800 ; 38 kio
-
 Subduction comparison.gif 1 600 × 666 ; 493 kio
-
 Subduction magma rising.jpg 288 × 157 ; 10 kio
-
 Subduction model from top.png 1 296 × 1 148 ; 35 kio
-
 Subduction motions.png 2 156 × 1 476 ; 204 kio
-
 Subduction polarity reversal.svg 595 × 842 ; 5 kio
-
 Subduction vector.png 2 184 × 1 470 ; 203 kio
-
 Subduction vectors.png 2 178 × 1 382 ; 191 kio
-
 Subduction Zone.jpg 656 × 304 ; 33 kio
-
 Subduction-gl.svg 1 579 × 859 ; 2,83 Mio
-
 Subduction-no-recycling.jpg 471 × 600 ; 59 kio
-
 Subduction.jpg 338 × 196 ; 14 kio
-
 Subduction.PNG 699 × 247 ; 10 kio
-
 Subduction.png 1 526 × 1 080 ; 201 kio
-
 SubductionDelamination.JPG 389 × 442 ; 17 kio
-
 Subduksiya zonası.png 1 717 × 578 ; 58 kio
-
 Subduzione.svg 883 × 617 ; 133 kio
-
 Szubdukció.jpg 557 × 483 ; 74 kio
-
 Toroidal flow oblique subduction.png 1 870 × 1 118 ; 97 kio
-
 Toroidal flow.png 1 886 × 1 134 ; 99 kio
-
 Trench retreat.png 1 984 × 1 346 ; 154 kio
-
 Trench- test.png 338 × 196 ; 5 kio
-
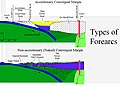 Types of Forearcs.jpg 890 × 636 ; 160 kio
-
 Upper to down NEW.jpg 241 × 310 ; 20 kio
-
 Upper to down NEW.svg 241 × 310 ; 20 kio
-
 Upper to down zh-tw.png 4 000 × 3 200 ; 295 kio
-
 Upper to upper zh-tw.png 4 000 × 3 200 ; 241 kio
-
 Upper to upper.jpg 278 × 214 ; 15 kio
-
 Upper to upper.svg 310 × 248 ; 16 kio
-
 USGS Visual Glossary-Accretionary wedge.gif 378 × 294 ; 24 kio
-
 Vertical fault.png 1 686 × 814 ; 44 kio
-
 Vertical fault3.png 2 162 × 1 232 ; 162 kio
-
 Vetődési típusok.jpg 659 × 442 ; 85 kio
-
 Volcanic Arc System SVG en.svg 700 × 480 ; 158 kio
-
 Volcanic Arc System SVG fr.svg 700 × 480 ; 263 kio
-
 Volcanic Arc System SVG.svg 612 × 482 ; 677 kio
-
 Wadati-Benioff zone he.jpg 915 × 657 ; 73 kio
-
 Wadati-Benioff zone.jpg 757 × 530 ; 49 kio
-
 Zona subduksi.PNG 456 × 298 ; 28 kio


.jpg)


_Tectonic_Evolution_(a).png)
_Tectonic_Evolution_(b).png)
_Tectonic_Evolution_(c).png)
_Tectonic_Evolution_(d).png)
_Tectonic_Evolution_(e).png)


