Category:Survival analysis
Zur Navigation springen
Zur Suche springen
branch of statistics for analyzing the expected duration of time until one or more significant events happen, such as death in biological organisms and failure in mechanical systems | |||||
| Medium hochladen | |||||
| Unterklasse von | |||||
|---|---|---|---|---|---|
| |||||
Unterkategorien
Es werden 4 von insgesamt 4 Unterkategorien in dieser Kategorie angezeigt:
In Klammern die Anzahl der enthaltenen Kategorien (K), Seiten (S), Dateien (D)
Medien in der Kategorie „Survival analysis“
Folgende 19 Dateien sind in dieser Kategorie, von 19 insgesamt.
-
 Aml data set sorted by survival time.png 510 × 790; 30 KB
-
 Aml survival times.svg 483 × 368; 44 KB
-
 Cox PH output for melanoma with thickness.png 733 × 388; 20 KB
-
 Cox proportional hazards regression output for melanoma data set.png 674 × 321; 15 KB
-
 Data resampling for discrete-time survival models.webp 685 × 419; 18 KB
-
 Date of 50th ratification of the TPNW.svg 630 × 630; 41 KB
-
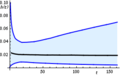 Hazardconf.png 261 × 163; 167 KB
-
 Histograms of melanoma thickness.png 1.301 × 486; 11 KB
-
 Kaplan-Meier by treatment in AML.svg 500 × 459; 58 KB
-
 Kaplan-Meier curve for aml with confidence bounds.svg 500 × 459; 57 KB
-
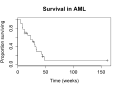 Kaplan-Meier plot of AML survival.svg 500 × 368; 42 KB
-
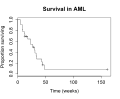 KM plot AML survival.svg 500 × 409; 47 KB
-
 Life table for the aml data.png 684 × 531; 29 KB
-
-
 Survival tree for prostate cancer.png 841 × 474; 70 KB
-
 Uscita a campana.svg 423 × 162; 6 KB
-
 Uscita lineare differita.svg 423 × 162; 4 KB
-
 Uscita lineare.svg 423 × 162; 4 KB
-
 Uscita simultanea.svg 423 × 162; 4 KB


