Category:Systems biology
Prijeđi na navigaciju
Prijeđi na pretraživanje
- (ar) علم أحياء الأنظمة
- (ca) Biologia de sistemes
- (de) Systembiologie
- (en) Category=Systems biology
- (es) Biología de sistemas
- (et) Süsteemibioloogia
- (fa) زیستشناسی سیستمها
- (fr) Biologie des systèmes
- (he) ביולוגיה מערכתית
- (it) Biologia dei sistemi
- (ja) システム生物学
- (ko) 계생명학
- (mk) Системска биологија
- (nl) Systeembiologie
- (pl) Biologia systemowa
- (pt) Biologia sistêmica
- (sv) Systembiologi
- (th) ชีววิทยาระบบ
- (vi) Sinh học hệ thống
- (zh) 系统生物学
computational and mathematical modeling of complex biological systems | |||||
| Postavi datoteku | |||||
| Zvučni zapis izgovora | |||||
|---|---|---|---|---|---|
| Jest | |||||
| Dio klase | |||||
| Različito od | |||||
| |||||
Systems biology is a biology-based inter-disciplinary study field that focuses on the systematic study of complex interactions in biological systems, thus using a new holistic perspective to study them.
Potkategorije
Ova kategorija ima sljedećih 17 potkategorija, od ukupno 17.
Mediji u kategoriji »Systems biology«
Prikazano je 188 datoteka u ovoj kategoriji, od njih ukupno 188.
-
 01RegulonDB.png 361 × 93; 30 KB
-
 11538 2016 214 Fig4 HTML.webp 530 × 472; 64 KB
-
 A thaliana metabolic network.png 836 × 882; 62 KB
-
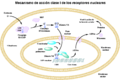 Acción de receptores nucleares I.png 1.497 × 994; 469 KB
-
 Acción de receptores nucleares II.png 1.502 × 1.129; 537 KB
-
 Acidobacterium.jpg 913 × 721; 504 KB
-
-
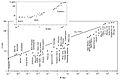
 Allometric Law of Body Mass vs Cruising Speed in Constructal Theory.svg 1.350 × 900; 160 KB
-
 Avesthagen.jpg 267 × 87; 5 KB
-
 Banner-COMBINE logo.png 4.476 × 321; 74 KB
-
 Banner-shadowed-COMBINE logo.png 4.506 × 351; 202 KB
-
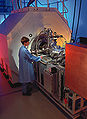
 Beamline at Brookhaven National Laboratory.jpg 646 × 700; 504 KB
-
 Beta oxidation and glycolysis.svg 525 × 460; 108 KB
-
 Bio network visualization.png 1.280 × 1.001; 171 KB
-
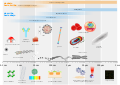
 Biological and technological scales compared-en.svg 1.062 × 755; 1,46 MB
-
 Biological and technological scales compared-es.svg 1.062 × 755; 1,52 MB
-
 Biological and technological scales compared-fr.svg 1.062 × 755; 1,46 MB
-
 Biological and technological scales compared-mk.svg 1.062 × 755; 1,59 MB
-
 Biological and technological scales compared-ru.svg 1.062 × 755; 1,51 MB
-
 Biovir.jpg 1.845 × 1.014; 193 KB
-
 CAM Kinase II.jpg 600 × 600; 143 KB
-
 CDMB2.png 1.083 × 1.084; 253 KB
-
 Cellcycle and growth.png 550 × 210; 20 KB
-
 CellML logo.svg 392 × 203; 19 KB
-
 COMBINE banner.svg 1.052 × 744; 12 KB
-
 COMBINE complete.svg 1.052 × 744; 12 KB
-
 COMBINE symbol.svg 1.052 × 744; 8 KB
-
 COMBINE word.svg 1.052 × 744; 11 KB
-
 Community of Cells.jpg 389 × 600; 177 KB
-
 Complete-COMBINE logo.png 1.626 × 380; 54 KB
-
 Complete-shadowed-COMBINE logo.png 1.634 × 410; 150 KB
-
 Computational biology.png 979 × 351; 14 KB
-
 Conformational proofreading in homologous recombination.jpg 1.886 × 3.214; 279 KB
-
 DendroscopeScreenCaptures.png 1.040 × 960; 75 KB
-
 DG Network in Hybrid Rice.png 402 × 236; 55 KB
-
 DNA microarray.jpg 280 × 285; 40 KB
-
 Double objective EVR.png 1.272 × 789; 36 KB
-
 Dynein coplex.jpg 600 × 644; 114 KB
-
 E coli metabolic network.png 277 × 417; 69 KB
-
 E.coli operon regulation network.jpg 834 × 694; 121 KB
-
 EmergyRatios5.png 2.330 × 1.480; 28 KB
-
 Equação Diferencial Estocástica.jpg 2.036 × 1.110; 181 KB
-
 Example-SBGN-AF.png 412 × 48; 8 KB
-
 Example-SBGN-ER.png 327 × 202; 13 KB
-
 Example-SBGN-PD.png 753 × 169; 26 KB
-
 Feedbackims.jpg 550 × 238; 45 KB
-
 Ferrell.jpg 661 × 389; 628 KB
-
 Fire board-01.tif 3.300 × 2.550; 32,72 MB
-
 FoodWebSimple-es.svg 779 × 640; 28 KB
-
 FoodWebSimple.svg 730 × 600; 24 KB
-
-
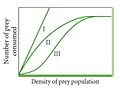 FunctionalResponsesGraph.jpg 625 × 477; 47 KB
-
 FunctionalResponsesGraph.svg 625 × 477; 8 KB
-
 FVA1TomForth.png 754 × 1.000; 140 KB
-
 FVA2TomForth.png 753 × 1.000; 131 KB
-
 Gene Regulatory Network 2.jpg 1.314 × 686; 336 KB
-
 Gene Regulatory Network.jpg 453 × 266; 78 KB
-
 Gene to Flux Pipeline.svg 596 × 92; 5 KB
-

-
-

-

-

-

-
 Genomics GTL Pictorial Program.jpg 1.000 × 657; 577 KB
-
 Genomics GTL Program Payoffs zh.jpg 750 × 563; 148 KB
-
 Genomics GTL Program Payoffs.jpg 750 × 563; 501 KB
-
 HierarchicalChunking.jpg 696 × 307; 61 KB
-
 Highlight Findings of the WA S0E 2007 report.gif 960 × 720; 81 KB
-

-

-

-
 Iarc.jpg 1.346 × 811; 304 KB
-
 IFTsimplificado.JPG 710 × 511; 41 KB
-
 IFTsimplified.JPG 710 × 511; 42 KB
-
 JevonsParadoxA.png 652 × 362; 12 KB
-
 JevonsParadoxB.png 652 × 362; 13 KB
-
 KiSAO logo.svg 518 × 519; 110 KB
-
 Lethal Gene Deletion.png 726 × 674; 64 KB
-
 LogoWhiteBackBlackLetters-75.png 75 × 36; 3 KB
-
 Ls-07 (9614847930).jpg 500 × 375; 181 KB
-
 Ls-08 (9614848526).jpg 500 × 375; 142 KB
-
 Ls-1 (9611612115).jpg 500 × 375; 116 KB
-
 Ls-2 (9614848366).jpg 500 × 375; 144 KB
-
 Ls-3 (9611611937).jpg 500 × 375; 89 KB
-
 Ls-4 (9611611833).jpg 500 × 375; 146 KB
-
 Ls-5 (9611611759).jpg 500 × 375; 70 KB
-
 Ls-6 (9611611673).jpg 500 × 375; 154 KB
-
 MAPKpathway diagram.svg 295 × 920; 33 KB
-
 MAPKpathway.png 294 × 920; 26 KB
-
 Mass Spectrometer.jpg 300 × 411; 157 KB
-
 Metabolic Network Model for Escherichia coli.jpg 400 × 500; 155 KB
-
 MFASystem 1.png 728 × 499; 31 KB
-
 MFASystem 2.png 711 × 368; 30 KB
-
 MFASystem 3.png 1.620 × 800; 33 KB
-
 Miase 170.png 170 × 114; 57 KB
-
 MIRIAM logo.png 747 × 499; 340 KB
-
 Modeling the dynamics of life 005.jpg 1.180 × 590; 139 KB
-
 Molecular Machines of Life.jpg 400 × 500; 152 KB
-
 Morgansystem.jpg 733 × 449; 647 KB
-
 Nahrungspyramide Schema.png 1.390 × 1.040; 90 KB
-
 Negative Feedback Loop with three reaction steps.pdf 708 × 187; 54 KB
-
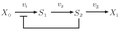
 NegFeedback FourSteps SNames.png 3.000 × 518; 57 KB
-
 NERSC Accomplishments.jpg 600 × 748; 305 KB
-
 Non lethal Gene Deletion.png 726 × 674; 73 KB
-
 Nuclear receptor action.png 2.990 × 1.794; 1.010 KB
-
 Pathway Kinetics.gif 379 × 336; 13 KB
-
 Pathway to genome.png 7.390 × 4.500; 3,27 MB
-
 Pathway to genome.svg 1.600 × 780; 4,98 MB
-
 PH-Regulation in Aspergillus.svg 900 × 700; 91 KB
-
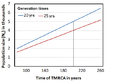 Popsize versus TMRCA and gentimes.PNG 666 × 454; 19 KB
-
 Poster for Nerve Circle's Weird Thing Zone, Williamsburg, Brooklyn 1991.tif 3.030 × 4.020; 69,74 MB
-
-
-
 Prepare for FBA maths.png 1.503 × 1.274; 194 KB
-
 Prepare for FBA.png 1.503 × 674; 43 KB
-
 Product portfolio EVR.png 1.465 × 836; 34 KB
-
 Proteasome.jpg 474 × 509; 130 KB
-
 Protein Complex.jpg 327 × 308; 73 KB
-
 Protein Machine.jpg 612 × 575; 179 KB
-
 Protein Machines.jpg 800 × 1.000; 187 KB
-
 Quantitative parasitology 1.JPG 598 × 434; 26 KB
-
 Quantitative Parasitology 30 windows.jpg 1.116 × 670; 88 KB
-
 Quantitative Parasitology on theWeb 10.jpg 921 × 611; 90 KB
-
 RAD Complex.jpg 500 × 500; 211 KB
-
 Recon 2.1 fig1.svg 562 × 202; 21 KB
-
 Recon 2.1 fig2.svg 562 × 131; 19 KB
-
 RegulonDBhead.gif 1.046 × 122; 9 KB
-
 RegulonDBSearchOptions.gif 233 × 117; 3 KB
-
 Resilience1.jpg 2.221 × 1.004; 215 KB
-
 Results of FBA maths.png 1.666 × 946; 162 KB
-
 Results of FBA.png 1.666 × 693; 147 KB
-
 Robert U. Ayres 2003.jpg 102 × 147; 3 KB
-
 SBGN-logo-WhiteBackground-1024.png 1.024 × 492; 87 KB
-
 SBGN-logo-WhiteBackground-150.png 150 × 72; 7 KB
-
 SBO logo.png 749 × 499; 318 KB
-
 SEDML logo.png 567 × 313; 18 KB
-
 Signal transduction pathways (zh-cn).svg 1.858 × 1.364; 146 KB
-
 Signal transduction pathways zh.png 1.858 × 1.364; 754 KB
-
 Signal transduction pathways.png 1.858 × 1.364; 709 KB
-
 Signal transduction v1.png 1.858 × 1.364; 253 KB
-
 Simple Branch Pathway.png 431 × 416; 7 KB
-
 Simple Branched Metabolic Pathway.pdf 222 × 166; 47 KB
-
 Simple Branched Metabolic Pathway.png 1.600 × 1.206; 63 KB
-
 SimpleReaction.png 1.328 × 871; 48 KB
-
 Single and double chromosomes.png 162 × 183; 4 KB
-

-

-

-
-

-
-
 Single-Cell-Analysis-of-Drug-Distribution-by-Intravital-Imaging-pone.0060988.s001.tiff 2.049 × 1.316; 1,17 MB
-
 Single-Cell-Analysis-of-Drug-Distribution-by-Intravital-Imaging-pone.0060988.s002.tiff 1.458 × 1.740; 1.023 KB
-
 Single-Cell-Analysis-of-Drug-Distribution-by-Intravital-Imaging-pone.0060988.s003.tiff 2.049 × 1.499; 1,27 MB
-

-
 Sistema del doble híbrido (Two-hybrid screening).JPG 835 × 490; 58 KB
-
 Skotheimsystem.jpg 573 × 572; 648 KB
-
 Statetable1.png 186 × 343; 4 KB
-
 Statetable2.png 186 × 342; 6 KB
-
 Streptomyces coelicolor sc.gif 250 × 250; 16 KB
-
 Summary of interactions between CD8+ T cells and Beta cells in Diabetes I.tif 2.248 × 1.245; 459 KB
-
 Supercomputers Will Decipher How Genes Work.jpg 1.000 × 750; 587 KB
-
 Symbol-COMBINE logo.png 317 × 312; 11 KB
-
 Symbol-shadowed-COMBINE logo.png 347 × 342; 30 KB
-
 Systembiologie.jpg 773 × 546; 57 KB
-
 Systems diagram of a city-es.png 2.484 × 1.671; 222 KB
-
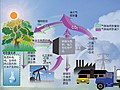
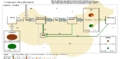
 Systems diagram of a city.png 2.484 × 1.671; 52 KB
-
Systems-Biology-Approach-to-Model-the-Life-Cycle-of-Trypanosoma-cruzi-pone.0146947.s004.ogv 3,7 s, 360 × 379; 102 KB
-
Systems-Biology-Approach-to-Model-the-Life-Cycle-of-Trypanosoma-cruzi-pone.0146947.s005.ogv 3,7 s, 360 × 379; 102 KB
-
Systems-Biology-Approach-to-Model-the-Life-Cycle-of-Trypanosoma-cruzi-pone.0146947.s006.ogv 3,7 s, 360 × 379; 87 KB
-
Systems-Biology-Approach-to-Model-the-Life-Cycle-of-Trypanosoma-cruzi-pone.0146947.s007.ogv 3,7 s, 360 × 379; 99 KB
-
Systems-Biology-Approach-to-Model-the-Life-Cycle-of-Trypanosoma-cruzi-pone.0146947.s008.ogv 3,7 s, 360 × 379; 105 KB
-
 TEDDY logo.svg 950 × 650; 21 KB
-
 TEDDY Ontology logo.png 960 × 640; 198 KB
-
 Trasduzione del segnale.png 1.858 × 1.364; 247 KB
-
 Type ii nuclear receptor action.png 2.999 × 2.249; 1.015 KB
-
-
-
-
-
-
-
 Whole plant mg transport.png 500 × 372; 51 KB
-
 Wikiresponsecurves1.jpg 1.832 × 3.460; 686 KB
-
 Word-COMBINE logo.png 1.596 × 321; 34 KB
-
 Word-shadowed-COMBINE logo.png 1.626 × 351; 92 KB
-
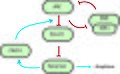
 Zyklus Netzwerkinferenz.jpg 1.280 × 720; 76 KB


.jpg)
.jpg)
.jpg)
.jpg)
.jpg)
.jpg)
.jpg)
.jpg)


.JPG)


.svg)