Category:Temperature
Pereiti į navigaciją
Jump to search
Deutsch: Die Temperatur (formeller: Absolute Temperatur) ist eine physikalische Zustandsgröße. Hohe Temperaturen bezeichnet man als "heiß", niedrige als "kalt".
English: Temperature is a physical property of a system that underlies the common notions of "hot" and "cold"; something that is hotter generally has the greater temperature.
physical property of matter that quantitatively expresses the common notions of hot and cold  | |||||
| Įkelti mediją | |||||
| Tarimas (garso failas) | |||||
|---|---|---|---|---|---|
| Tai yra | |||||
| Poklasis |
| ||||
| Skiriasi nuo | |||||
| |||||
Subkategorijos
Rodomos 34 subkategorijos (iš viso yra 34 subkategorijos).
A
- Absolute zero temperature (9 F)
B
C
- Cold adaptation (2 F)
- Temperature control (15 F)
D
H
I
K
L
M
R
T
- Temperature-entropy diagrams (104 F)
U
W
Daugialypės terpės rinkmenos kategorijoje „Temperature“
Rodomi 163 šios kategorijos rinkmenos (iš viso kategorijoje yra 163 rinkmenos).
-
LL-Q7026 (cat)-Unjoanqualsevol-temperatura.wav 1,4 s; 121 KiB
-
Cs-teplota.ogg 1,3 s; 16 KiB
-
De-Temperatur.ogg 2,0 s; 20 KiB
-
LL-Q188 (deu)-Sebastian Wallroth-Temperatur.wav 1,3 s; 123 KiB
-
En-us-temperature.ogg 1,2 s; 14 KiB
-
LL-Q143 (epo)-Lepticed7-temperaturo.wav 1,4 s; 131 KiB
-
Fr-température.ogg 1,6 s; 19 KiB
-
LL-Q150 (fra)-Lyokoï-température.wav 1,3 s; 113 KiB
-
Nl-temperatuur.ogg 1,4 s; 15 KiB
-
Pl-temperatura.ogg 1,9 s; 21 KiB
-
Ru-температура.ogg 1,1 s; 16 KiB
-
LL-Q9027 (swe)-Ainali-temperatur.wav 1,3 s; 123 KiB
-
Sv-temperatur.ogg 1,7 s; 20 KiB
-
Uk-температура.ogg 1,5 s; 18 KiB
-
 2019120308 Casio ProTrek PRW 60Y-1AER temperature display 6400iso 2019.jpg 6 016 × 4 000; 6,96 MiB
-
 A Guide to Cosmic Temperatures (SVS14374).png 5 530 × 8 192; 60,52 MiB
-
 A hand after using the Blood Cooler.jpg 3 264 × 2 448; 2,08 MiB
-
 Africa temperature-es.png 2 036 × 2 747; 1,7 MiB
-
 Africa temperature.png 2 036 × 2 747; 2,36 MiB
-
 Air Quality Monitoring with Arduino.svg 981 × 928; 1,53 MiB
-
 Amplificazionetraslazione.png 490 × 508; 9 KiB
-
 Andes Mountains.tiff 2 113 × 3 249; 26,19 MiB
-
 Anomalies relative to 1961–1990 baseline with +0.9 °C offset (unless indicated).webp 2 167 × 1 245; 285 KiB
-
 Another hand after Blood Cooler use.jpg 2 448 × 3 264; 1,64 MiB
-
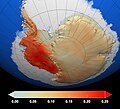 Antarctic surface trends.jpg 3 200 × 2 917; 2,23 MiB
-
 Arm counter-current flow.jpg 1 000 × 528; 121 KiB
-
 Banana man.webp 593 × 593; 221 KiB
-
 Bibliography on the high temperature chemistry and physics of materials, April, May, June 1969 (IA bibliographyonhi3152diam).pdf 1 068 × 1 450, 86 puslapiai; 3,9 MiB
-
 Böyük Qafqaz təbii vilayətində atmosfer yağıntılarının illik temperaturu.jpg 2 893 × 2 039; 966 KiB
-
 Böyük Qafqaz təbii vilayətində havanın orta illik temperaturu2.jpg 2 893 × 2 039; 1,01 MiB
-
 Calibration equipments.JPG 3 264 × 2 448; 1,57 MiB
-
 Calle de Preciados - Madrid - 01.jpg 3 410 × 5 115; 9,76 MiB
-
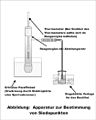
 Central ventilation tube2-ar.jpg 250 × 167; 11 KiB
-
 Central ventilation tube2.jpg 250 × 167; 7 KiB
-
 Cold control packaging.jpg 402 × 302; 27 KiB
-
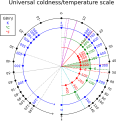 ColdnessScale.svg 312 × 324; 76 KiB
-
 Control de temperatura.JPG 5 152 × 3 864; 7,78 MiB
-
 Cool dog 2208-1468.jpg 4 509 × 3 009; 3,3 MiB
-
De-°F.ogg 2,4 s; 22 KiB
-
De-°R.ogg 2,4 s; 24 KiB
-
De-°Re.ogg 2,1 s; 20 KiB
-
De-°Réaumur.ogg 2,3 s; 22 KiB
-
 Desert Storm Homecoming Edition Box.jpg 938 × 1 000; 133 KiB
-
 Dice Head Helmet Prototype.jpg 3 000 × 4 000; 2,9 MiB
-
 Disolución del café.svg 1 024 × 768; 1,1 MiB
-
ECCO2 Sea Surface Temperature and Flows.ogv 53 s, 1 280 × 720; 25 MiB
-
 Egon portrait.jpg 3 264 × 2 448; 1,44 MiB
-

-
 Entleuchtete Brennerflamme.svg 373 × 274; 10 KiB
-

-
 Fridze.jpg 1 024 × 768; 113 KiB
-
 Funny King The Baby Craze. Sophia.jpg 896 × 1 095; 172 KiB
-
 Global sea surface and land-air temperature anomalies since 1850.webp 1 057 × 1 193; 155 KiB
-
 Global Temperature Trends.png 904 × 480; 52 KiB
-
 Grafico 3.png 1 818 × 958; 294 KiB
-
 Grafico Temperatura.png 2 052 × 1 064; 630 KiB
-
 Grape Humberto after a haircut.png 131 × 152; 36 KiB
-
 Greenland-temperatures-over-the-last-2-thousand-years.png 780 × 632; 37 KiB
-
 Hasler 1578 temperature scale.jpg 665 × 976; 267 KiB
-
 Heat Transfer.gif 360 × 229; 1,05 MiB
-
 Heating-of-water-with-phase-transitions-no-energy-values.svg 444 × 245; 39 KiB
-
 Heating-of-water-with-phase-transitions.svg 444 × 245; 35 KiB
-

-
 Ilava január.PNG 400 × 326; 14 KiB
-
 Ilava júl.PNG 400 × 326; 13 KiB
-
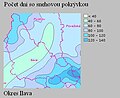
 Ilava zrážky.PNG 400 × 326; 13 KiB
-
 Imagem paint Termoscópio.png 2 272 × 2 840; 113 KiB
-
 Inside... (316382618).jpg 1 024 × 768; 744 KiB
-
 Its cold -( (2228932778).jpg 320 × 480; 18 KiB
-
 James-Lovelock-Abrupt-Climate-Change-Model-ca-2009.png 1 758 × 1 080; 304 KiB
-
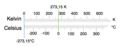 Kelvin og Celsius temperaturskalaer.png 564 × 222; 25 KiB
-
 Laser Cooling Thermometer.png 3 676 × 4 500; 175 KiB
-
 Lorem-Ipsum-Tekst.jpg 2 558 × 1 076; 487 KiB
-
 Medición de Temperatura Diferencial.pdf 1 239 × 1 752, 4 puslapiai; 44 KiB
-
 Michael Powell.jpg 3 072 × 4 608; 1,92 MiB
-
 Minecraft Head Example.png 1 111 × 1 111; 67 KiB
-
 Misuratore di temperatura con Arduino.svg 443 × 515; 767 KiB
-
 Miten lämpöenergia siirtyy?.svg 1 052 × 744; 7,1 MiB
-
 Mixing-fluids-same-substance.svg 1 055 × 394; 11 KiB
-
 Mixing-fluids.svg 1 055 × 394; 11 KiB
-
 MSR145 with connection for K-type thermocouple.JPG 2 048 × 1 536; 1,09 MiB
-
 Mund VS - Water Tunnel (27954235143).jpg 5 200 × 3 468; 7,69 MiB
-
NegativeTemperature.webm 43 s, 480 × 480; 8,27 MiB
-
 Normalsiedetemperaturen.svg 323 × 168; 7 KiB
-
 Ocean influence on climate at four example locations.png 2 000 × 750; 131 KiB
-
 PECO T8532-002.png 1 272 × 968; 672 KiB
-
 Previsione arima temperatura media italiana.png 672 × 332; 39 KiB
-
 Propane butane liquid vapor density zivenko.png 1 102 × 753; 69 KiB
-
 PSM V12 D430 Pressure and boiling point.jpg 555 × 362; 28 KiB
-
 PyRefB.jpg 2 338 × 1 644; 2,06 MiB
-
 Realspyship.png 1 080 × 1 622; 1,53 MiB
-
 Relation Zéro absolu, Chaleur, Agitation des particules-fr.jpg 710 × 647; 72 KiB
-
Ru-холод.ogg 1,0 s; 14 KiB
-
 Sadekul Hasan.jpg 2 270 × 3 089; 736 KiB
-
 Schematic pulstuberefridgerator.jpg 1 446 × 472; 117 KiB
-
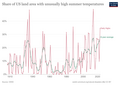 Share of US land area with unusually high summer temperatures, OWID.png 3 400 × 2 400; 926 KiB
-
 Siedepunkt3.JPG 420 × 525; 37 KiB
-
 Sneh Ilava 2.PNG 400 × 326; 13 KiB
-
 Sneh Ilava.JPG 400 × 326; 22 KiB
-
 Sunrise in African countries.jpg 3 024 × 4 032; 1,7 MiB
-
 T-S diagram.png 1 416 × 672; 20 KiB
-
 Temp sensitive glass tile.jpg 380 × 285; 14 KiB
-
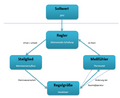 Temperatur als Regelkreis.png 629 × 516; 31 KiB
-
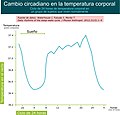 Temperatura corporal en un ciclo de 24 horas.jpg 2 726 × 2 619; 758 KiB
-
 Temperatura san mateo.png 745 × 210; 11 KiB
-
 Temperatura001.png 344 × 543; 7 KiB
-
 Temperaturas valenzuela.jpg 876 × 42; 18 KiB
-
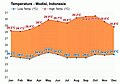 Temperature - Modisi, Indonesia.jpg 1 000 × 700; 70 KiB
-
 Temperature Anomalies (42301692072).jpg 1 280 × 720; 93 KiB
-
 Temperature Anomalies 1880-2017 (42064683815).jpg 1 280 × 720; 35 KiB
-
 Temperature Anomalies 1880-2017 (42247583324).png 1 920 × 1 080; 425 KiB
-
 Temperature anomalies 1900-2016 (36460919305).jpg 6 340 × 8 217; 9,76 MiB
-
 Temperature anomalies 1900-2016 horizontal (36544614296).jpg 8 652 × 6 132; 9,35 MiB
-
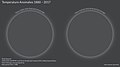
 Temperature anomalies 1980 (36265512256).png 1 800 × 1 800; 1,68 MiB
-
 Temperature anomalies 2016 (36306825555).png 1 800 × 1 800; 1,8 MiB
-
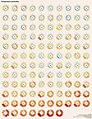
 Temperature anomalies arranged by country 1900 - 2018. (46907749091).jpg 1 840 × 1 400; 206 KiB
-
 Temperature Anomalies Arranged By Country 1900-2017 (39782625301).jpg 1 920 × 1 080; 201 KiB
-
 Temperature Anomalies by Country 1880-2017 (30562013098).jpg 1 920 × 1 080; 152 KiB
-
 Temperature Anomalies By Country 1900-2017 (39801302421).jpg 1 440 × 1 080; 168 KiB
-
 Temperature Anomalies By Country 1900-2017 (slow) (39769587572).jpg 1 440 × 1 080; 168 KiB
-
 Temperature Anomalies By Country Jan-Aug 2017 (37165762561).jpg 1 840 × 1 400; 218 KiB
-
 Temperature Anomalies Histogram (40804692082).jpg 1 280 × 720; 44 KiB
-
 Temperature Anomalies Map (39645978115).jpg 1 800 × 900; 115 KiB
-
 Temperature anomalies October 2017 Capitals (26693053199).jpg 7 600 × 6 200; 4,11 MiB
-
 Temperature Anomaly Lights (49164536791).jpg 2 880 × 1 080; 118 KiB
-
 Temperature Circle - The Future (32143092107).jpg 1 280 × 720; 91 KiB
-
 Temperature gauge (2186666519).jpg 3 296 × 2 472; 3,47 MiB
-
 Temperature in eV.svg 256 × 512; 19 KiB
-
 Temperature indicator mounted in gimbals for marine work-Tracts vol 10 p53.jpg 984 × 1 472; 476 KiB
-
-
 Temperature Table.pdf 1 275 × 1 650; 29 KiB
-
 Temperature time series Victoria BC Canada 1978 to 2019.jpg 2 400 × 1 200; 319 KiB
-
 Temperature u Panamskom kanalu.png 542 × 356; 14 KiB
-
 Temperature Variation Situation.svg 512 × 537; 34 KiB
-
 Temperature vertical distribution japanese.svg 300 × 400; 35 KiB
-
 Temperature zone of earth.jpg 2 560 × 1 920; 912 KiB
-
 Temperature-and-internal-energy.svg 912 × 520; 9 KiB
-
 Temperature-Scale diagram.jpg 800 × 494; 32 KiB
-
 Temperaturens avvikelse från långtidsmedelvärdet 1900-2016 (24366786498).jpg 1 840 × 1 440; 217 KiB
-
 Température de la mer janvier 2012.png 460 × 608; 93 KiB
-
 Température mer janvier 2009.png 800 × 610; 115 KiB
-
 Termometar (Bourdonov).jpg 801 × 1 239; 106 KiB
-
 Tetraterm annual 1961-1990.png 900 × 1 100; 216 KiB
-
 Tetraterm annual 1991-2020.png 900 × 1 100; 219 KiB
-
 Thermograph hg.jpg 3 250 × 3 250; 719 KiB
-
 Thermometer B (20 x 20 px).png 20 × 20; 449 bytes
-
 Thermometer B.jpg 300 × 300; 29 KiB
-
 Thermometer Fever 40.png 1 950 × 2 085; 74 KiB
-
 Thermometer from problem 76 in Leurechon's Recreations mathématiques.png 292 × 887; 313 KiB
-
 Thermometer R (20 x 20 px).png 20 × 20; 467 bytes
-
 Thermometer R.jpg 300 × 300; 29 KiB
-
 Thermoscope.svg 600 × 713; 66 KiB
-
 Vergleich Fahrenheit und Celsius.svg 434 × 134; 15 KiB
-
 Vesinikühendite keemist.png 632 × 564; 35 KiB
-
 VIA EPIA N700-10EWNano-ITX Board (3791656942).jpg 720 × 624; 140 KiB
-
Viral-gene-expression-regulation-ppat.1002591.s005.ogv 15 s, 504 × 480; 2,2 MiB
-
 WBGT check table 01-ja.svg 900 × 900; 497 KiB
-
Wie kann man Temperatur definieren?.webm 1 min 19 s, 1 920 × 1 080; 39,15 MiB
-
 Willi Schatz 02.jpg 1 280 × 720; 110 KiB
-
 Wskaznikempirycznytemperatura.jpg 3 187 × 1 752; 881 KiB
-
 Yes it was very hot - Flickr - gailhampshire.jpg 3 858 × 2 088; 701 KiB
-
 Zeitreihe Temperatur Mittelland bisher und für Klimaszenarien RCP2.6-RCP8.5.pdf 1 002 × 500; 31 KiB
-
 日射や発熱体のない室内における湿球黒球温度(WBGT)の推定表.svg 600 × 800; 703 KiB

.png)


.webp)


.jpg)
.jpg)


.jpg)


.jpg)
.jpg)
.png)
.jpg)
.jpg)
.png)
.png)
.jpg)
.jpg)
.jpg)
.jpg)
_(39769587572).jpg)
.jpg)
.jpg)
.jpg)
.jpg)
.jpg)
.jpg)


.jpg)


.jpg)


.png)


.png)


.jpg)


%E3%81%AE%E6%8E%A8%E5%AE%9A%E8%A1%A8.svg)
.jpg)