Category:Transport in Germany
Vai alla navigazione
Vai alla ricerca
trasporti  | |||||
| Carica un file multimediale | |||||
| Istanza di | |||||
|---|---|---|---|---|---|
| Parte di | |||||
| Aspetto di | |||||
| Luogo |
| ||||
| Consiste di | |||||
| Ha sostituito | |||||
| |||||
Sottocategorie
Questa categoria contiene le 54 sottocategorie indicate di seguito, su un totale di 54.
*
+
A
B
D
E
F
- FUSS e.V. (2 F)
G
H
I
L
M
- Milk delivery in Germany (2 F)
O
P
- Porters in Germany (4 F)
- Pulleys in Germany (7 F)
R
S
- Skid marks in Germany (7 F)
T
V
- Verkehrsblatt (empty)
W
File nella categoria "Transport in Germany"
Questa categoria contiene 21 file, indicati di seguito, su un totale di 21.
-
 Abbiegen.jpg 3 599 × 2 482; 989 KB
-
 Abbiegen2.jpg 1 754 × 1 241; 321 KB
-
 Anteil Güterverkehrssysteme D 2010.png 520 × 448; 4 KB
-
 Anzahl verkaufter Fahrräder und Ebikes in De bis 2022.svg 620 × 319; 54 KB
-
 Bestand an Fahrrädern in De bis 2023.svg 605 × 340; 46 KB
-
 Unfallkosten Bild2.JPG 934 × 444; 140 KB
-
 Fahrneigungsregister Personen.svg 800 × 600; 25 KB
-
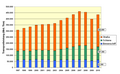 Gew Gütertransport D 1997bis2010.png 970 × 601; 31 KB
-
 Gütertransport D 1997bis2010.png 873 × 585; 14 KB
-
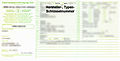 KFZ-Schein mit Schlüsselnummern.jpg 1 676 × 849; 453 KB
-
 Konzept der Verkehrswende.svg 504 × 329; 155 KB
-
 Means of transport in Germany 2000.png 756 × 504; 20 KB
-
 My diagram to Germany - A.svg 343 × 204; 6 KB
-
 Number of reported road incidents, OWID.svg 850 × 600; 9 KB
-
 PEVs in use Top countries & regional markets 2020.png 960 × 763; 132 KB
-
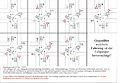
 Ratio of traffic mode in freight transport in Germany 2002.png 720 × 535; 20 KB
-
 Ratio of traffic mode in passenger transport in Germany 2002.png 618 × 523; 17 KB
-
 Regiobahn.png 2 081 × 301; 84 KB
-
 Top EV market share 2022.png 958 × 648; 159 KB
-
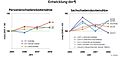
 Verkehrsleistung in Deutschland, Personen-km, 1994-2019.svg 2 268 × 983; 100 KB
-
 Verkehrsleistung in Deutschland, Personen-km, 2003-2019.svg 1 063 × 461; 75 KB


