Category:Treemaps
Aller à la navigation
Aller à la recherche
représentation graphique de données hiérarchique  | |||||
| Téléverser des médias | |||||
| Sous-classe de | |||||
|---|---|---|---|---|---|
| Dépeint | données hiérarchiques | ||||
| Découvert(e) ou inventé(e) par | |||||
| Date de découverte ou d'invention |
| ||||
| |||||
Sous-catégories
Cette catégorie comprend 4 sous-catégories, dont les 4 ci-dessous.
E
I
S
T
Média dans la catégorie « Treemaps »
Cette catégorie comprend 58 fichiers, dont les 58 ci-dessous.
-
 2010 Federal Budget Treemap.tif 987 × 546 ; 528 kio
-
 ABŞ-də danışılan dillərin cədvəli.png 984 × 741 ; 38 kio
-
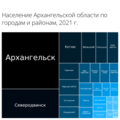 Arh treemap.png 4 000 × 4 000 ; 361 kio
-
 Articles on Wikipedia in French by country 2021.svg 512 × 512 ; 75 kio
-
 Baobab-treemap-ru.png 676 × 482 ; 25 kio
-
 Cumulated CO2 Emissions.jpg 1 554 × 1 182 ; 897 kio
-
 Disk space treemap lg.png 1 348 × 789 ; 116 kio
-
 Fossil and biogenic methane policies currently in force by type of policy instrument.jpg 3 272 × 4 159 ; 839 kio
-
 FY17-18 WMF AP cross-department programs.jpg 686 × 608 ; 161 kio
-
 Gradient grouped treemap.jpg 999 × 697 ; 202 kio
-
 Heatmap incito.png 266 × 198 ; 5 kio
-
 Northern Cyprus Assembly of the Republic seats, 2013.png 1 882 × 1 164 ; 50 kio
-
 Occupations by Share in Michigan.png 2 278 × 1 362 ; 794 kio
-
 Population of Japan by area, 1884 JA.png 734 × 697 ; 23 kio
-
 Population of Japan by area, 1898 JA.png 734 × 697 ; 26 kio
-
 Population of Japan by area, 1950 JA.png 734 × 697 ; 31 kio
-
 Population of Japan by area, 2000 JA.png 734 × 697 ; 30 kio
-
 Population of Japan by area, 2015 JA.png 734 × 697 ; 28 kio
-
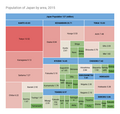 Population of Japan by area, 2015.png 734 × 696 ; 50 kio
-
 Population of Japan by area, 2030 JA.png 734 × 697 ; 29 kio
-
 Population of Japan by area, 2045 JA.png 734 × 697 ; 28 kio
-
 São Bernardo do Campo - Exports 2014.svg 1 670 × 859 ; 279 kio
-
 Titanic passengers.png 5 600 × 5 200 ; 1,48 Mio
-
 Top causes of early deaths globally by number in 2019, Our World in Data treemap.png 12 858 × 9 886 ; 2,39 Mio
-
 Top100 states area treemap pop-density.svg 1 490 × 1 600 ; 23 kio
-

-
 Tree map of emission responsibility allotments in 2009 by selected country and industry.webp 2 050 × 1 023 ; 157 kio
-
 Tree Map of Industries by Share in New York (2014).png 4 776 × 1 362 ; 1,41 Mio
-
 Tree map of languages in the United States.png 984 × 741 ; 31 kio
-
 Tree Map of Majors in Ohio (Bachelor's Degree).png 2 336 × 1 126 ; 644 kio
-
 Tree Map of Massachusetts Universities by Share of Total Degrees Awarded.png 3 620 × 1 180 ; 870 kio
-
 Tree Map of Occupations by Share in California (2014).png 2 320 × 1 362 ; 788 kio
-
 Tree Map of Universities in Missouri.png 3 872 × 1 132 ; 887 kio
-
 Tree Map of Universities in North Carolina.png 2 832 × 1 132 ; 707 kio
-
 Tree Map Showing Share of Total Degrees Awarded at Universities in Washington.png 3 620 × 1 132 ; 798 kio
-
 Tree Map-Atividades Economicas em Salvador (2012).png 1 540 × 591 ; 139 kio
-
 Tree Map-Industries in Sao Paulo (2012).png 1 542 × 782 ; 220 kio
-
 Tree Map.png 869 × 684 ; 41 kio
-
 Tree-map of public sector investments in GeneXpert development.tif 1 267 × 867 ; 159 kio
-
 Treemap da eleição presidencial no Brasil em 2014.png 878 × 456 ; 15 kio
-
 TreeMap en.jpg 791 × 830 ; 341 kio
-
 Treemap of Employment by Industry in Oklahoma (2020).png 1 750 × 973 ; 572 kio
-

-

-

-
-

-

-
 中国 Chn treemap.png 1 106 × 865 ; 283 kio
-
 俄国 Rus treemap.png 1 104 × 863 ; 121 kio
-
 北朝鲜 Prk treemap.png 1 104 × 861 ; 265 kio
-
 南非 Zaf treemap.png 1 106 × 866 ; 210 kio
-
 尼日利亚 Nga treemap.png 1 104 × 863 ; 64 kio
-
 巴西 Bra treemap.png 1 104 × 860 ; 217 kio
-
 德国 Deu treemap.png 1 106 × 864 ; 215 kio
-
 法国 Fra treemap.png 1 105 × 867 ; 220 kio
-
 美国 Usa treemap.png 1 107 × 863 ; 249 kio
-
 肯尼亚 Ken treemap.png 1 103 × 862 ; 240 kio


.png)
.png)
.png)


.png)
.jpg)
.jpg)
.jpg)
.jpg)
.jpg)
.jpg)


.png)
.png)