File:1939 Atlantic hurricane season summary map.png
跳转到导航
跳转到搜索
本预览的尺寸:678 × 599像素。 其他分辨率:272 × 240像素 | 543 × 480像素 | 869 × 768像素 | 1,158 × 1,024像素 | 2,317 × 2,048像素 | 3,000 × 2,652像素。
原始文件 (3,000 × 2,652像素,文件大小:4.14 MB,MIME类型:image/png)
说明
说明
添加一行文字以描述该文件所表现的内容
摘要[编辑]
摘要
| 描述 |
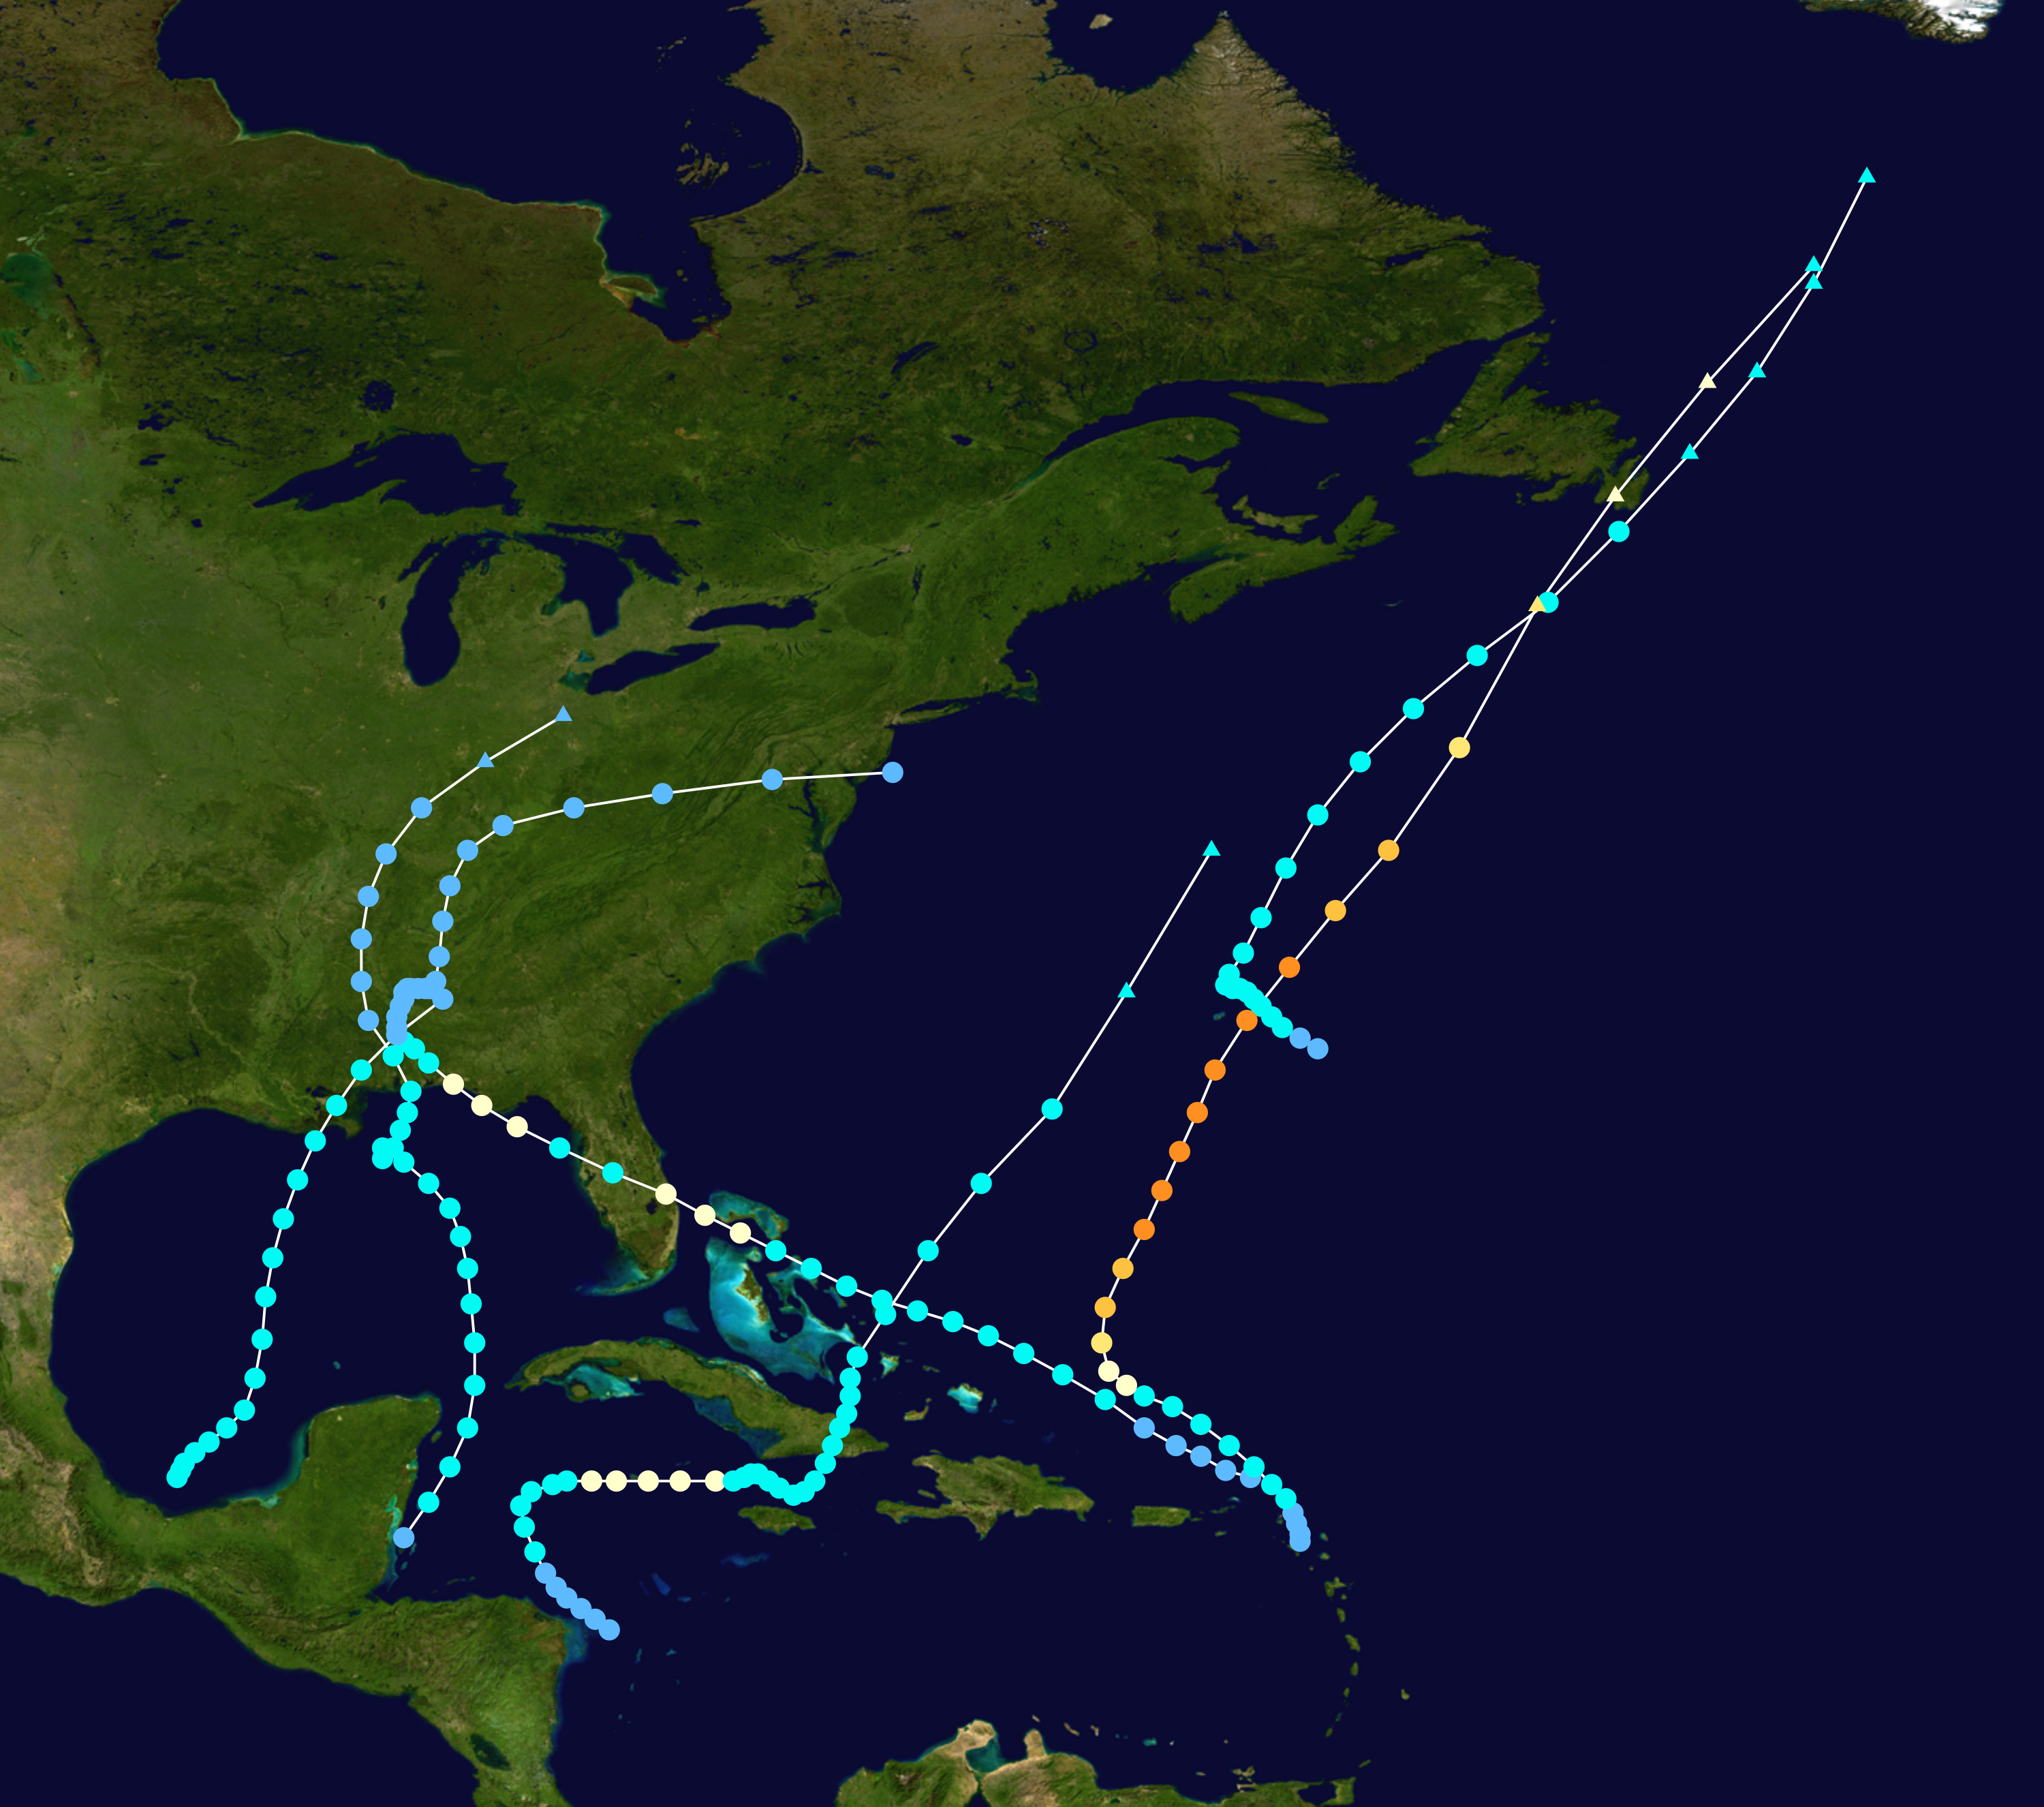
English: Track map of all storms of the 1939 Atlantic hurricane season. The points show the location of the storm at 6-hour intervals. The colour represents the storm's maximum sustained wind speeds as classified in the (see below), and the shape of the data points represent the nature of the storm, according to the legend below. Tropical depression (≤38 mph, ≤62 km/h)
Tropical storm (39–73 mph, 63–118 km/h)
Category 1 (74–95 mph, 119–153 km/h)
Category 2 (96–110 mph, 154–177 km/h)
Category 3 (111–129 mph, 178–208 km/h)
Category 4 (130–156 mph, 209–251 km/h)
Category 5 (≥157 mph, ≥252 km/h)
Unknown
Storm type |
| 日期 | 2012-12-22– |
| 来源 | Created by Cyclonebiskit using Wikipedia:WikiProject Tropical cyclones/Tracks. The background image is from NASA. Tracking data is from Tracking data from the National Hurricane Center's Hurricane Database.[1]. |
| 作者 | Cyclonebiskit |

|
该文件可能会更新以反映新信息 如果您希望在不镜像新更新的情况下使用该文件的特定版本,请将所需版本作为单独的文件上传。 |
许可协议[编辑]
| 本作品已被作者Cyclonebiskit释出到公有领域。这适用于全世界。 在一些国家这可能不合法;如果是这样的话,那么: Cyclonebiskit无条件地授予任何人以任何目的使用本作品的权利,除非这些条件是法律规定所必需的。 |
文件历史
点击某个日期/时间查看对应时刻的文件。
| 日期/时间 | 缩略图 | 大小 | 用户 | 备注 | |
|---|---|---|---|---|---|
| 当前 | 2012年12月22日 (六) 23:26 | | 3,000 × 2,652(4.14 MB) | Cyclonebiskit(留言 | 贡献) | {{WPTC track map | author = Cyclonebiskit | name = all storms | article = 1939 Atlantic hurricane season#Storms | season = 1939 Atlantic hurricane season | start = 2012-12-22 | end = | othersource=Tracking data from the {{w|National Hurricane Center}... |
您不可以覆盖此文件。
文件用途
以下页面使用本文件:
全域文件用途
以下其他wiki使用此文件:
- en.wikipedia.org上的用途
- www.wikidata.org上的用途
- zh.wikipedia.org上的用途