File:1955 Pacific typhoon season summary map.png
跳转到导航
跳转到搜索

本预览的尺寸:727 × 600像素。 其他分辨率:291 × 240像素 | 582 × 480像素 | 931 × 768像素 | 1,241 × 1,024像素 | 2,483 × 2,048像素 | 3,000 × 2,475像素。
原始文件 (3,000 × 2,475像素,文件大小:5.96 MB,MIME类型:image/png)
说明
说明
添加一行文字以描述该文件所表现的内容
| 描述 |
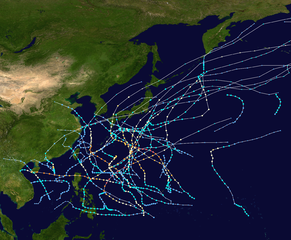
English: This map shows the tracks of all tropical cyclones in the 1955 Pacific typhoon season. The points show the location of each storm at 6-hour intervals. The colour represents the storm's maximum sustained wind speeds as classified in the Saffir-Simpson Hurricane Scale (see below), and the shape of the data points represent the type of the storm.
Tropical depression (≤38 mph, ≤62 km/h)
Tropical storm (39–73 mph, 63–118 km/h)
Category 1 (74–95 mph, 119–153 km/h)
Category 2 (96–110 mph, 154–177 km/h)
Category 3 (111–129 mph, 178–208 km/h)
Category 4 (130–156 mph, 209–251 km/h)
Category 5 (≥157 mph, ≥252 km/h)
Unknown
Storm type |
| 来源 | Created using Wikipedia:WikiProject Tropical cyclones/Tracks. The background image is from NASA [1]. The tracking data |
| 作者 | Supportstorm |

|
This file may be updated to reflect new information. If you wish to use a specific version of the file without new updates being mirrored, please upload the required version as a separate file. |
| 本作品已被作者Supportstorm释出到公有领域。这适用于全世界。 在一些国家这可能不合法;如果是这样的话,那么: Supportstorm无条件地授予任何人以任何目的使用本作品的权利,除非这些条件是法律规定所必需的。 |
文件历史
点击某个日期/时间查看对应时刻的文件。
| 日期/时间 | 缩略图 | 大小 | 用户 | 备注 | |
|---|---|---|---|---|---|
| 当前 | 2014年9月10日 (三) 10:18 | | 3,000 × 2,475(5.96 MB) | Supportstorm(留言 | 贡献) | Smaller dot size |
| 2013年9月17日 (二) 11:53 |  | 3,000 × 2,475(5.96 MB) | Supportstorm(留言 | 贡献) | Resized area | |
| 2013年8月29日 (四) 01:38 |  | 3,000 × 2,068(5 MB) | Supportstorm(留言 | 贡献) | {{Hurricane season auto track map|start=|end=|source=IBTrACS|type=typhoon|basin=Pacific|year=1955|author=Supportstorm}} |
您不可以覆盖此文件。
文件用途
没有页面使用本文件。
全域文件用途
以下其他wiki使用此文件:
- en.wikipedia.org上的用途
- pt.wikipedia.org上的用途
- th.wikipedia.org上的用途
- vi.wikipedia.org上的用途
- zh.wikipedia.org上的用途