File:1973 Atlantic hurricane season summary map.png
Μετάβαση στην πλοήγηση
Πήδηση στην αναζήτηση

Μέγεθος αυτής της προεπισκόπησης: 800 × 494 εικονοστοιχεία . Άλλες αναλύσεις: 320 × 198 εικονοστοιχεία | 640 × 396 εικονοστοιχεία | 1.024 × 633 εικονοστοιχεία | 1.280 × 791 εικονοστοιχεία | 3.000 × 1.854 εικονοστοιχεία.
Πρωτότυπο αρχείο (3.000 × 1.854 εικονοστοιχεία, μέγεθος αρχείου: 3,99 MB, τύπος MIME: image/png)
Λεζάντες
Λεζάντες
Δεν ορίστηκε λεζάντα
| Περιγραφή |
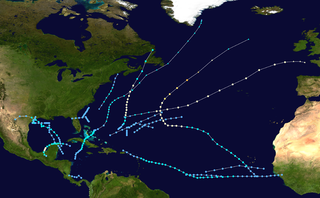
English: This map shows the tracks of all tropical cyclones in the 1973 Atlantic hurricane season. The points show the location of each storm at 6-hour intervals. The colour represents the storm's maximum sustained wind speeds as classified in the Saffir-Simpson Hurricane Scale (see below), and the shape of the data points represent the type of the storm.
Tropical depression (≤38 mph, ≤62 km/h)
Tropical storm (39–73 mph, 63–118 km/h)
Category 1 (74–95 mph, 119–153 km/h)
Category 2 (96–110 mph, 154–177 km/h)
Category 3 (111–129 mph, 178–208 km/h)
Category 4 (130–156 mph, 209–251 km/h)
Category 5 (≥157 mph, ≥252 km/h)
Unknown
Storm type |
| Πηγή | Created using Wikipedia:WikiProject Tropical cyclones/Tracks. The background image is from NASA [1]. The tracking data is from the National Hurricane Center's Atlantic hurricane database |
| Δημιουργός | Cyclonebiskit |
| Το έργο αυτό έχει απελευθερωθεί στην public domain από τον δημιουργό του, Cyclonebiskit. Αυτό ισχύει σε όλο τον κόσμο. Σε ορισμένες χώρες αυτό μπορεί να μην είναι νομικά εφικτό. Αν ναι: Cyclonebiskit Παραχωρώ σε οποιονδήποτε το δικαίωμα να χρησιμοποιήσει αυτό το έργο "για οποιονδήποτε σκοπό", χωρίς κανέναν όρο, εκτός και αν τέτοιοι όροι τίθενται από την νομοθεσία |
Ιστορικό αρχείου
Πατήστε σε μια ημερομηνία/ώρα για να δείτε το αρχείο όπως εμφανιζόταν εκείνη την χρονική στιγμή.
| Ημερομηνία/Ώρα | Μικρογραφία | Διαστάσεις | Χρήστης | Σχόλιο | |
|---|---|---|---|---|---|
| τρέχον | 18:26, 9 Ιουνίου 2013 | | 3.000 × 1.854 (3,99 MB) | Supportstorm (συζήτηση | Συνεισφορά) | Higher resolution |
| 17:03, 28 Σεπτεμβρίου 2009 |  | 1.024 × 633 (564 KB) | Cyclonebiskit (συζήτηση | Συνεισφορά) | {{Information |Description={{en|Track map of the 1973 Atlantic hurricane season. The points show the location of the storm at 6-hour intervals. The colour represents the storm's [[:w:maximum sustained wind|maximum sust |
Δεν μπορείτε να αντικαταστήσετε αυτό το αρχείο.
Χρήση αρχείου
Δεν υπάρχουν σελίδες που χρησιμοποιούν αυτό το αρχείο.
Καθολική χρήση αρχείου
Τα ακόλουθα άλλα wiki χρησιμοποιούν αυτό το αρχείο:
- Χρήση σε en.wikipedia.org
- 1973 Atlantic hurricane season
- Template:1973 Atlantic hurricane season buttons
- Tropical Storm Gilda (1973)
- Wikipedia:Good topics
- Hurricane Brenda (1973)
- Tropical Storm Delia (1973)
- Tropical Storm Christine (1973)
- Wikipedia:Featured and good topic candidates/1973 Atlantic hurricane season/archive1
- Wikipedia:Featured and good topic candidates/Featured log/October 2009
- Wikipedia:Featured and good topic candidates/Good log/October 2009
- Wikipedia:Featured topics/1973 Atlantic hurricane season
- Χρήση σε es.wikipedia.org
- Χρήση σε pt.wikipedia.org
- Χρήση σε ru.wikipedia.org
- Χρήση σε zh.wikipedia.org