File:1990 Pacific hurricane season summary map.png
跳至導覽
跳至搜尋

預覽大小:800 × 526 像素。 其他解析度:320 × 211 像素 | 640 × 421 像素 | 1,024 × 674 像素 | 1,280 × 842 像素 | 2,220 × 1,461 像素。
原始檔案 (2,220 × 1,461 像素,檔案大小:2.24 MB,MIME 類型:image/png)
說明
說明
添加單行說明來描述出檔案所代表的內容
摘要
[編輯]
| 描述 |
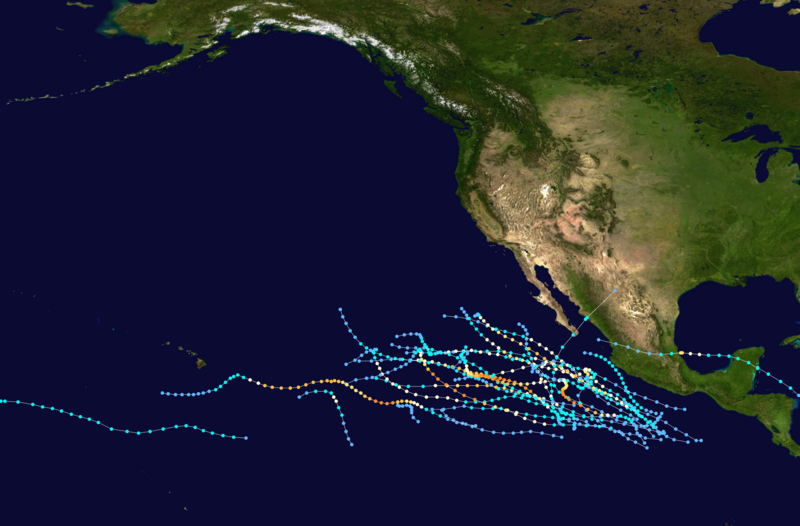
English: This map shows the tracks of all tropical cyclones in the 1990 Pacific hurricane season. The points show the location of each storm at 6-hour intervals. The colour represents the storm's maximum sustained wind speeds as classified in the Saffir-Simpson Hurricane Scale (see below), and the shape of the data points represent the type of the storm.
Tropical depression (≤38 mph, ≤62 km/h)
Tropical storm (39–73 mph, 63–118 km/h)
Category 1 (74–95 mph, 119–153 km/h)
Category 2 (96–110 mph, 154–177 km/h)
Category 3 (111–129 mph, 178–208 km/h)
Category 4 (130–156 mph, 209–251 km/h)
Category 5 (≥157 mph, ≥252 km/h)
Unknown
Storm type |
| 日期 |
|
| 來源 | Created using Wikipedia:WikiProject Tropical cyclones/Tracks. The background image is from NASA [1]. The tracking data is from the National Hurricane Center and the Central Pacific Hurricane Center's Northeast and North Central Pacific hurricane database |
| 作者 | Modokai |
| 此作品已由其作者,Modokai,釋出至公有領域。此授權條款在全世界均適用。 這可能在某些國家不合法,如果是的話: Modokai授予任何人有權利使用此作品於任何用途,除受法律約束外,不受任何限制。 |
| 描述 |
English: 1990 Pacific hurricane season summary map |
| 日期 | |
| 來源 | 自己的作品 |
| 作者 | Modokai |
授權條款
[編輯]
我,本作品的著作權持有者,決定用以下授權條款發佈本作品:
此檔案採用共享創意 姓名標示-相同方式分享 4.0 國際授權條款。
- 您可以自由:
- 分享 – 複製、發佈和傳播本作品
- 重新修改 – 創作演繹作品
- 惟需遵照下列條件:
- 姓名標示 – 您必須指名出正確的製作者,和提供授權條款的連結,以及表示是否有對內容上做出變更。您可以用任何合理的方式來行動,但不得以任何方式表明授權條款是對您許可或是由您所使用。
- 相同方式分享 – 如果您利用本素材進行再混合、轉換或創作,您必須基於如同原先的相同或兼容的條款,來分布您的貢獻成品。
檔案歷史
點選日期/時間以檢視該時間的檔案版本。
| 日期/時間 | 縮圖 | 尺寸 | 用戶 | 備註 | |
|---|---|---|---|---|---|
| 目前 | 2023年9月8日 (五) 02:11 | | 2,220 × 1,461(2.24 MB) | Sria-72(對話 | 貢獻) | Standardization |
| 2020年1月31日 (五) 02:08 |  | 3,000 × 1,854(4.28 MB) | Modokai(對話 | 貢獻) | User created page with UploadWizard |
無法覆蓋此檔案。
檔案用途
沒有使用此檔案的頁面。
全域檔案使用狀況
以下其他 wiki 使用了這個檔案:
- en.wikipedia.org 的使用狀況
- zh.wikipedia.org 的使用狀況