File:1996 Pacific typhoon season summary map.png
ナビゲーションに移動
検索に移動

このプレビューのサイズ: 800 × 600 ピクセル。 その他の解像度: 320 × 240 ピクセル | 640 × 480 ピクセル | 1,024 × 768 ピクセル | 1,280 × 960 ピクセル | 2,560 × 1,920 ピクセル | 4,000 × 3,000 ピクセル。
元のファイル (4,000 × 3,000 ピクセル、ファイルサイズ: 8.46メガバイト、MIME タイプ: image/png)
キャプション
キャプション
このファイルの内容を1行で記述してください
| 解説 |
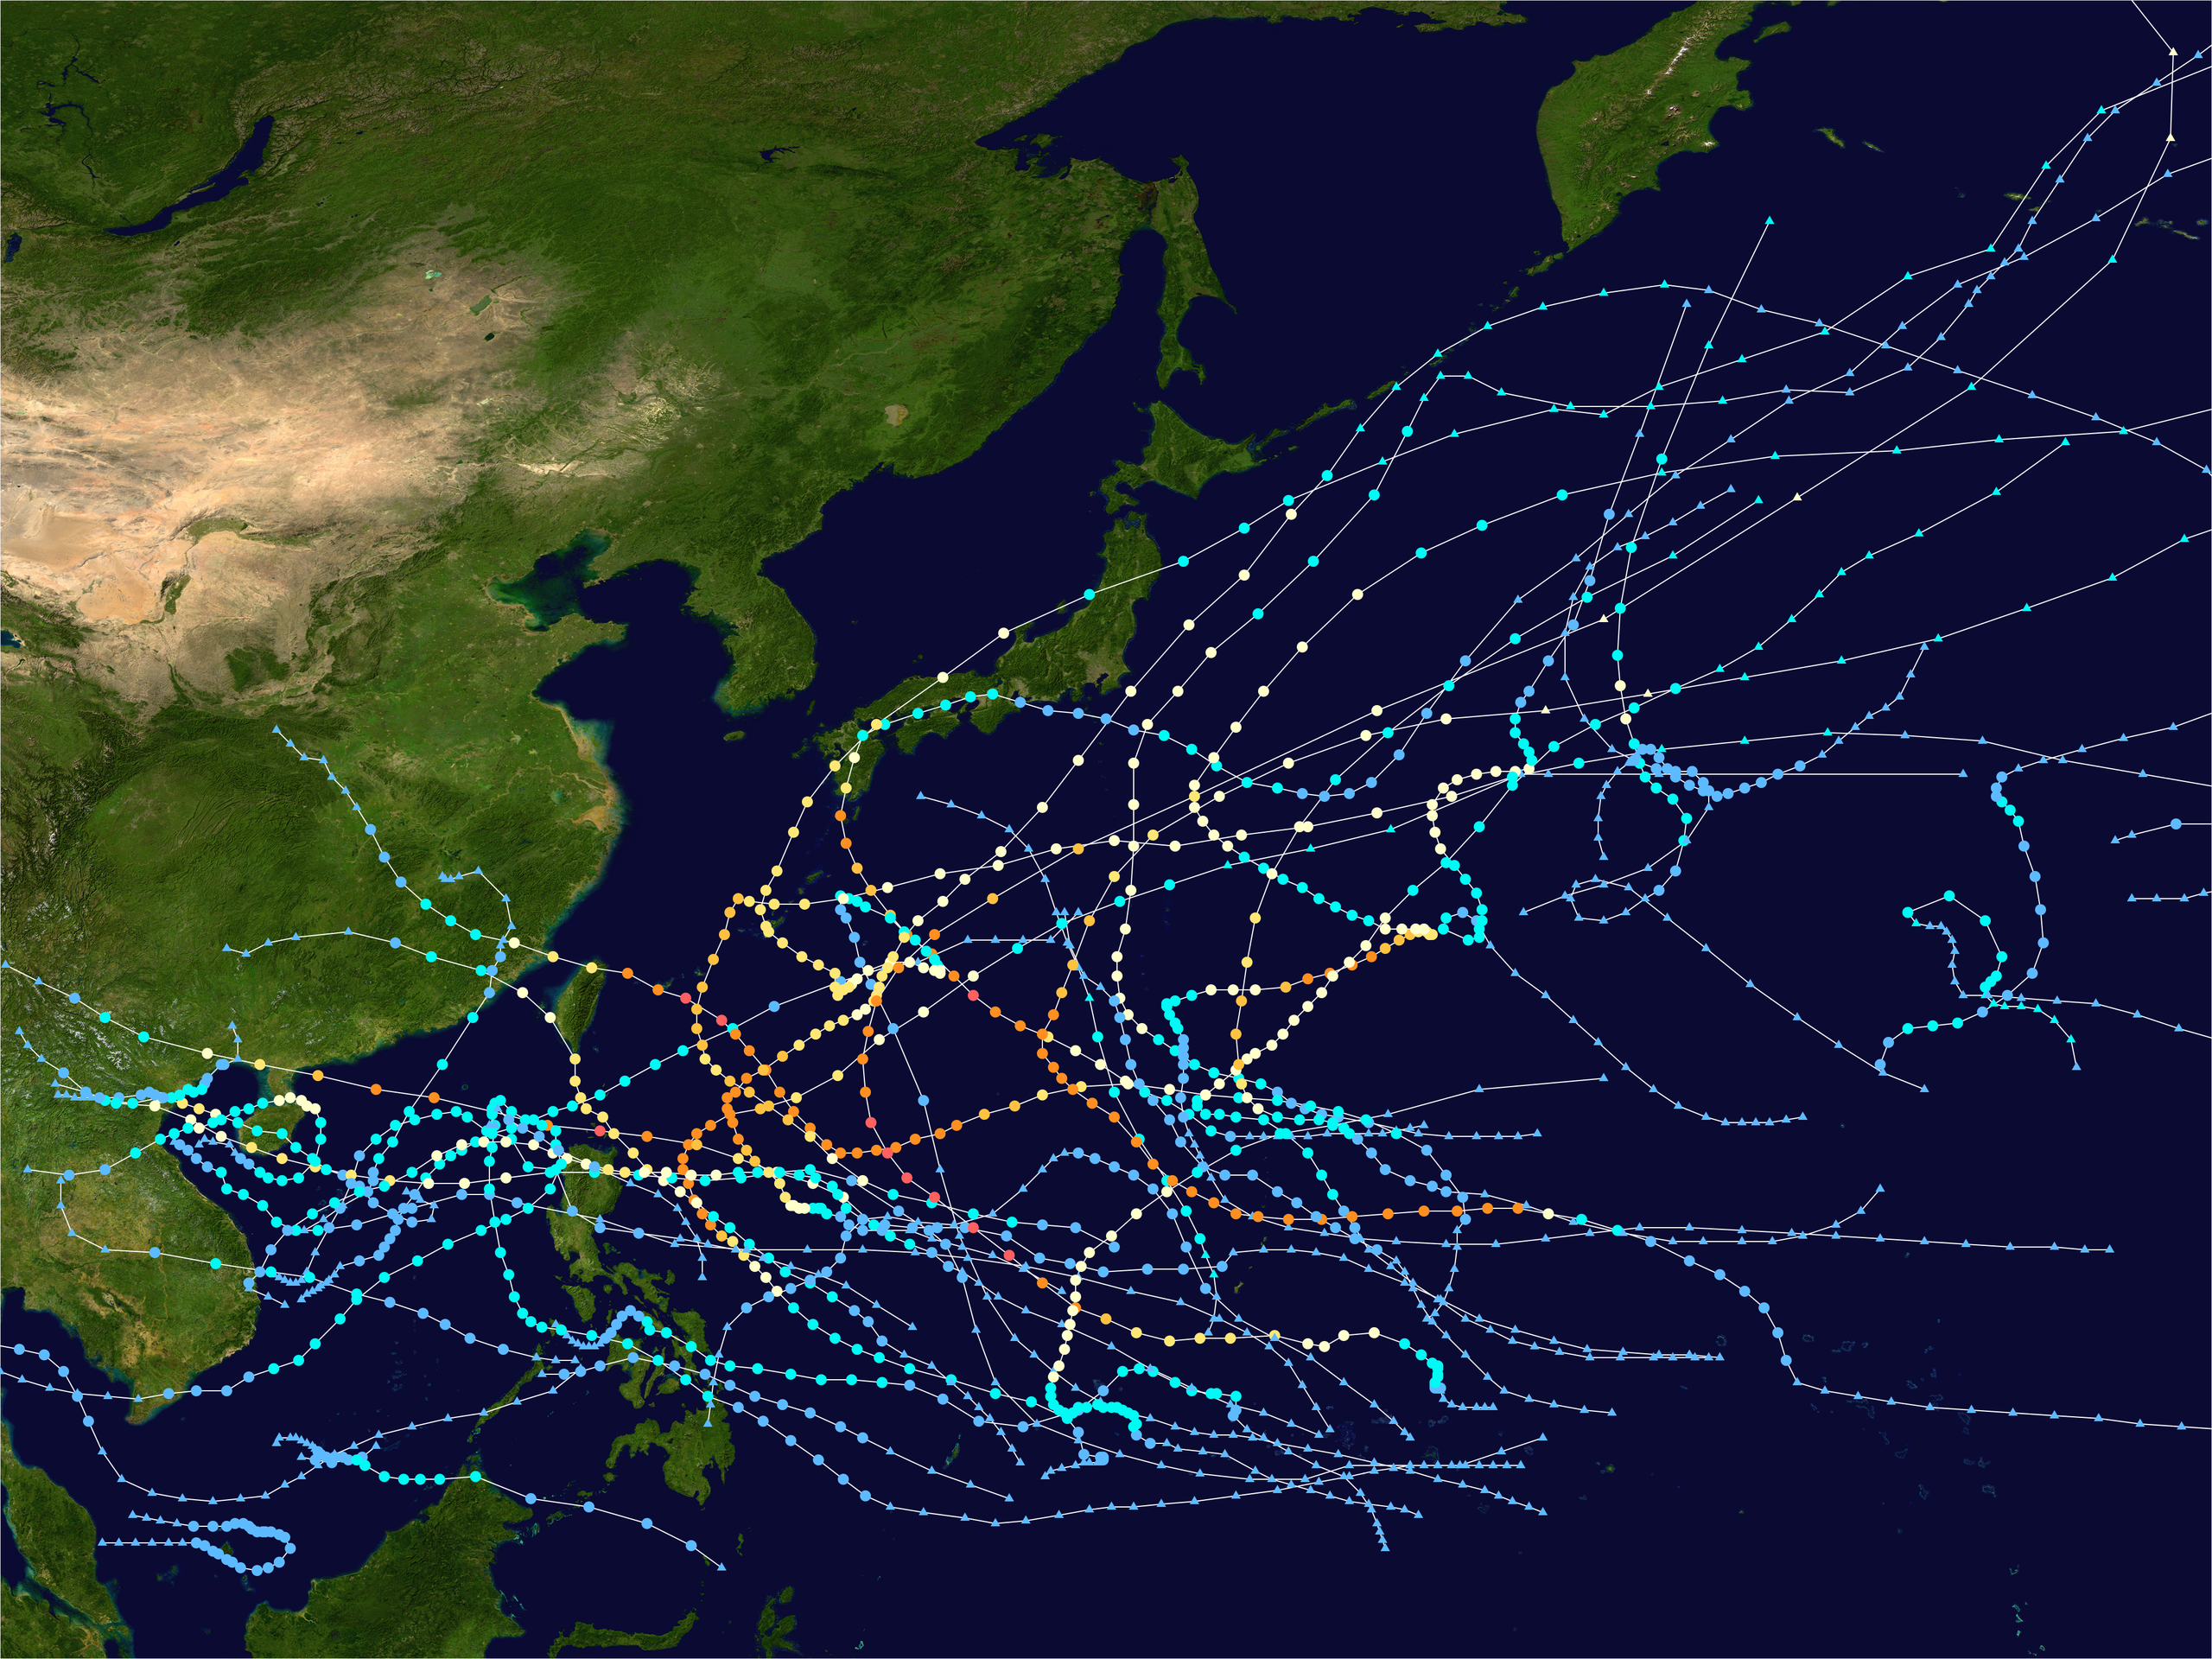
English: This map shows the tracks of all tropical cyclones in the 1996 Pacific typhoon season. The points show the location of each storm at 6-hour intervals. The colour represents the storm's maximum sustained wind speeds as classified in the Saffir-Simpson Hurricane Scale (see below), and the shape of the data points represent the type of the storm.
Tropical depression (≤38 mph, ≤62 km/h)
Tropical storm (39–73 mph, 63–118 km/h)
Category 1 (74–95 mph, 119–153 km/h)
Category 2 (96–110 mph, 154–177 km/h)
Category 3 (111–129 mph, 178–208 km/h)
Category 4 (130–156 mph, 209–251 km/h)
Category 5 (≥157 mph, ≥252 km/h)
Unknown
Storm type |
| 原典 | Created using Wikipedia:WikiProject Tropical cyclones/Tracks. The background image is from NASA [1]. The tracking data is from the Joint Typhoon Warning Center's best track database |
| 作者 | FleurDeOdile |
| この著作物は、著作者であるFleurDeOdileによって権利が放棄され、パブリックドメインとされました。これは全世界で適用されます。 一部の国では、これが法的に可能ではない場合があります。その場合は、次のように宣言します。 FleurDeOdileは、あらゆる人に対して、法により必要とされている条件を除き、如何なる条件も課すことなく、あらゆる目的のためにこの著作物を使用する権利を与えます。 |
ファイルの履歴
過去の版のファイルを表示するには、その版の日時をクリックしてください。
| 日付と時刻 | サムネイル | 寸法 | 利用者 | コメント | |
|---|---|---|---|---|---|
| 現在の版 | 2020年1月4日 (土) 00:43 | | 4,000 × 3,000 (8.46メガバイト) | FleurDeOdile (トーク | 投稿記録) | User created page with UploadWizard |
このファイルは上書きできません。
ファイルの使用状況
このファイルを使用しているページはありません。
グローバルなファイル使用状況
以下に挙げる他のウィキがこの画像を使っています:
- en.wikipedia.org での使用状況
- ja.wikipedia.org での使用状況
- ko.wikipedia.org での使用状況
- pt.wikipedia.org での使用状況
- vi.wikipedia.org での使用状況
- zh.wikipedia.org での使用状況