File:Analytic.png

Fichier d’origine (1 250 × 875 pixels, taille du fichier : 86 kio, type MIME : image/png)
Légendes
Légendes

|
Une version vectorielle de cette image existe, dans le format « SVG ». Elle devrait être utilisée à la place de cette image matricielle.
File:Analytic.png → File:Analytic.svg
Pour plus d’informations sur les images vectorielles, consultez la page de transition de Commons vers le format SVG. Voir aussi les informations à propos de la manière dont le logiciel MediaWiki gère les images au format SVG. |
 |
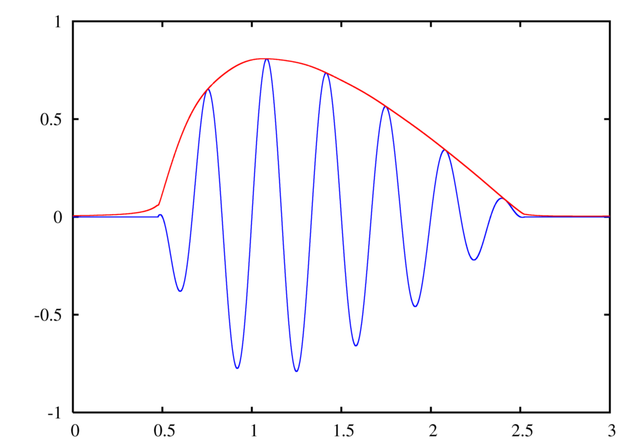
A signal and the magnitude of its analytic signal, to demonstrate the envelope effect, made with GNU Octave.
Instructions[modifier]
See Wikipedia graph-making tips.
These can be copied and pasted, saved to the Octave work directory as a .m file (such as analytic.m), and executed by typing the name of the file: analytic.
To convert the PostScript file to PNG:
- Open it in the GIMP (make sure you have ghostscript installed! - Windows instructions)
- Enter 500 under Resolution (it doesn't say "DPI" but I think that's what it means)
- Uncheck Try bounding box (since the bounding box cuts off the edge, unfortunately. You can try with the bounding box first.)
- Enter large values for Width and Height
- Check Color
- Check Strong anti-aliasing for both graphics and text
- Crop off extra whitespace (Shift+C if you can't find it in the toolbox)
- Possibly need to rotate it: Click Image → Transform → Rotate 90 degrees clockwise
Filters → Blur → Gaussian blur at 2.0 px(No need to blur if you use strong anti-aliasing during conversion. I see no significant difference between end results.)- Image → Scale Image...
- Width and Height at 25%
- Cubic interpolation
- You can view at normal size if you want by pressing 1, Ctrl+E
- Save as Analytic.png
Created by User:Omegatron using gnuplot, possibly with post-processing in the GIMP (PNG) or Inkscape (SVG)
- Vous êtes libre :
- de partager – de copier, distribuer et transmettre cette œuvre
- d’adapter – de modifier cette œuvre
- Sous les conditions suivantes :
- paternité – Vous devez donner les informations appropriées concernant l'auteur, fournir un lien vers la licence et indiquer si des modifications ont été faites. Vous pouvez faire cela par tout moyen raisonnable, mais en aucune façon suggérant que l’auteur vous soutient ou approuve l’utilisation que vous en faites.
- partage à l’identique – Si vous modifiez, transformez, ou vous basez sur cette œuvre, vous devez distribuer votre contribution sous la même licence ou une licence compatible avec celle de l’original.

|
Vous avez la permission de copier, distribuer et modifier ce document selon les termes de la GNU Free Documentation License version 1.2 ou toute version ultérieure publiée par la Free Software Foundation, sans sections inaltérables, sans texte de première page de couverture et sans texte de dernière page de couverture. Un exemplaire de la licence est inclus dans la section intitulée GNU Free Documentation License. |
(In short, this means that you can copy and modify the image freely as long as you provide attribution; preferably in the form of a link back to this page.)
Historique du fichier
Cliquer sur une date et heure pour voir le fichier tel qu'il était à ce moment-là.
| Date et heure | Vignette | Dimensions | Utilisateur | Commentaire | |
|---|---|---|---|---|---|
| actuel | 6 juillet 2005 à 03:39 | | 1 250 × 875 (86 kio) | Omegatron (d | contributions) | updated now that I know pretty plots |
| 26 juin 2005 à 19:53 |  | 563 × 371 (4 kio) | Omegatron (d | contributions) | A graph or diagram made by User:Omegatron. (Uploaded with Wikimedia Commons.) Source: Created by User:Omegatron {{GFDL}}{{cc-by-sa-2.0}} Category:Diagrams\ |
Vous ne pouvez pas remplacer ce fichier.
Utilisations locales du fichier
Les 2 pages suivantes utilisent ce fichier :
Utilisations du fichier sur d’autres wikis
Les autres wikis suivants utilisent ce fichier :
- Utilisation sur de.wikipedia.org
- Utilisation sur en.wikipedia.org
- Utilisation sur fr.wikipedia.org
- Utilisation sur it.wikipedia.org
- Utilisation sur ru.wiktionary.org
- Utilisation sur sr.wikipedia.org
- Utilisation sur vi.wiktionary.org