File:Anbil-figure4-20200228.png
维基共享资源,媒体文件资料库
跳转到导航
跳转到搜索
Anbil-figure4-20200228.png (644 × 498像素,文件大小:36 KB,MIME类型:image/png)
文件信息
结构化数据
说明
说明
添加一行文字以描述该文件所表现的内容
摘要[编辑]
| 描述Anbil-figure4-20200228.png |
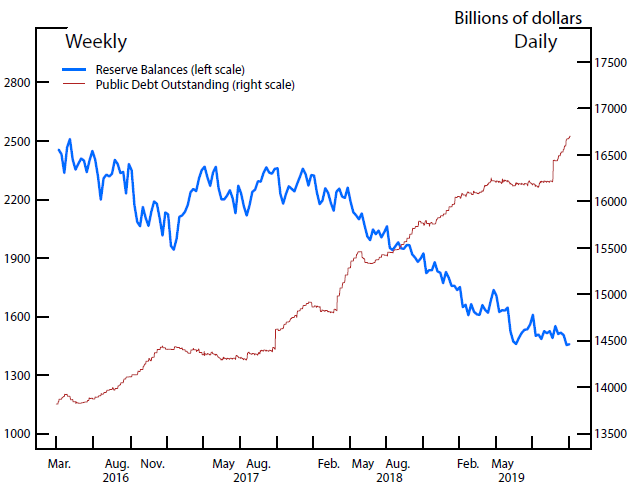
English: Treasury securities outstanding (the red line) versus reserve balances (the blue line) since January 2016. While reserves were declining, total Treasury securities outstanding were increasing. |
| 日期 | |
| 来源 | https://www.federalreserve.gov/econres/notes/feds-notes/what-happened-in-money-markets-in-september-2019-20200227.htm |
| 作者 | Sriya Anbil, Alyssa Anderson, and Zeynep Senyuz |
许可协议[编辑]
| Public domainPublic domainfalsefalse |
| This work is in the public domain in the United States because it is a work of the Board of Governors of the Federal Reserve System. This does not apply to any other entity within the Federal Reserve System, including the regional Federal Reserve Banks. |  |
文件历史
点击某个日期/时间查看对应时刻的文件。
| 日期/时间 | 缩略图 | 大小 | 用户 | 备注 | |
|---|---|---|---|---|---|
| 当前 | 2021年5月17日 (一) 16:44 |  | 644 × 498(36 KB) | JBchrch(留言 | 贡献) | Uploaded a work by Sriya Anbil, Alyssa Anderson, and Zeynep Senyuz from https://www.federalreserve.gov/econres/notes/feds-notes/what-happened-in-money-markets-in-september-2019-20200227.htm with UploadWizard |
您不可以覆盖此文件。
文件用途
没有页面使用本文件。
全域文件用途
以下其他wiki使用此文件:
- en.wikipedia.org上的用途
- fa.wikipedia.org上的用途
- zh.wikipedia.org上的用途
元数据
此文件中包含有额外的信息。这些信息可能是由数码相机或扫描仪在创建或数字化过程中所添加。
如果文件已从其原始状态修改,某些细节可能无法完全反映修改后的文件。
| 水平分辨率 | 37.79 dpc |
|---|---|
| 垂直分辨率 | 37.79 dpc |
