File:Anbil-figure4-20200228.png
出自Wikimedia Commons
跳至導覽
跳至搜尋
Anbil-figure4-20200228.png (644 × 498 像素,檔案大小:36 KB,MIME 類型:image/png)
檔案資訊
結構化資料
說明
說明
添加單行說明來描述出檔案所代表的內容
摘要
[編輯]| 描述Anbil-figure4-20200228.png |
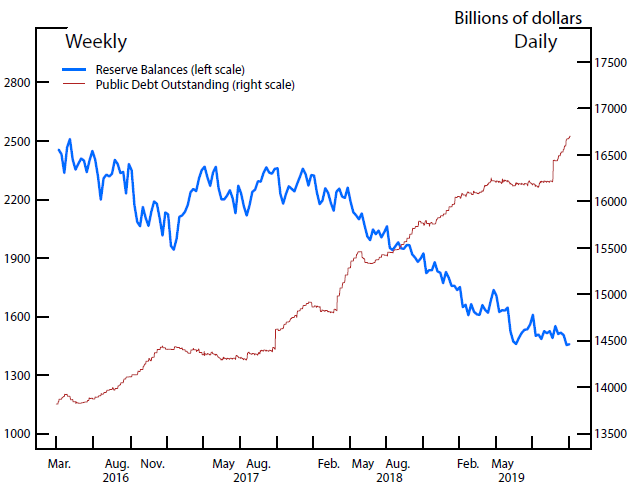
English: Treasury securities outstanding (the red line) versus reserve balances (the blue line) since January 2016. While reserves were declining, total Treasury securities outstanding were increasing. |
| 日期 | |
| 來源 | https://www.federalreserve.gov/econres/notes/feds-notes/what-happened-in-money-markets-in-september-2019-20200227.htm |
| 作者 | Sriya Anbil, Alyssa Anderson, and Zeynep Senyuz |
授權條款
[編輯]| Public domainPublic domainfalsefalse |
| This work is in the public domain in the United States because it is a work of the Board of Governors of the Federal Reserve System. This does not apply to any other entity within the Federal Reserve System, including the regional Federal Reserve Banks. |  |
檔案歷史
點選日期/時間以檢視該時間的檔案版本。
| 日期/時間 | 縮圖 | 尺寸 | 使用者 | 備註 | |
|---|---|---|---|---|---|
| 目前 | 2021年5月17日 (一) 16:44 |  | 644 × 498(36 KB) | JBchrch(留言 | 貢獻) | Uploaded a work by Sriya Anbil, Alyssa Anderson, and Zeynep Senyuz from https://www.federalreserve.gov/econres/notes/feds-notes/what-happened-in-money-markets-in-september-2019-20200227.htm with UploadWizard |
無法覆蓋此檔案。
檔案用途
沒有使用此檔案的頁面。
全域檔案使用狀況
以下其他 wiki 使用了這個檔案:
- en.wikipedia.org 的使用狀況
- fa.wikipedia.org 的使用狀況
- zh.wikipedia.org 的使用狀況
詮釋資料
此檔案中包含其他資訊,這些資訊可能是由數位相機或掃描器在建立或數位化過程中所新增的。若檔案自原始狀態已被修改,一些詳細資料可能無法完整反映出已修改的檔案。
| 水平解析度 | 37.79 dpc |
|---|---|
| 垂直解析度 | 37.79 dpc |
